Publication (Preprint): Quantitative Metrological Analysis and Reproduction Protocol of the Kumburgaz Face
The main analysis available on Zenodo is based on a purely visual initial examination of a still image, which is presented here. Explanatory notes regarding the reproduction protocol for the identified pupil positions and other morphological ocular analogs can be found in the next section. The detailed metrological analysis of the visible eye structures revealed extreme metric rigidity (SD = 0.010). Based on the summary of the CBE findings and the best explanation, a classification of this non-human intelligence (NHI) as a Constructed Biological Entity (CBE) is proposed, suggesting a biotechnological design.
Data Access: Analysis and Materials: Citation: Lacson, C. (2026). Quantitative Metrological Analysis of Anomalous Signatures. Zenodo.
Call for Validation: We invite professionals and researchers—particularly those from the fields of metrology, statistics, image analysis, UAP research, and astrobiology—to participate in a cross-validation of our protocol. To fully address the complexity of our data, we also welcome expertise from other disciplines that can contribute to a critical review and confirmation of the CBE findings.
Internal Note: Please use v8 as the current reference. We apologize for any inconvenience caused by previous versions. To ensure consistent documentation across all language versions, the dataset has been updated in this version.
Is your area of expertise missing from our list? We are convinced that interdisciplinary exchange is the key to progress. Please feel free to contact us if you would like to contribute your expertise.
Reproduction Protocol for the Extraction of Ocular Morphology: Accompanying explanation regarding the main analysis reproduction protocol (see Table A3 in the Appendix)
Preliminary Note on Validation: To correctly validate the results presented here and to ensure metrological integrity, the following workflow in Adobe Photoshop (Version 26.11.0 or newer) must be strictly adhered to. Any deviation from the specified numerical values (Phases II, III, IV) alters the metrological basis.
Phase I: File Preparation and Import (Protocol Step 1)
- Step 1: Load working file (TIFF): Upload the working file (Fig. 2, TIFF format) or the ROI file (Fig. 4) to Adobe Photoshop. Ensure that the correct color profile is imported and confirmed. This file is Layer 1.
- Check coordinate system: The Photoshop coordinate system used (program version 26.11.0) must define the Y-axis as "negative top, positive bottom" (i.e., the Y-axis origin is located in the top left) to ensure the correct aspect ratio.
Phases II to IV: Chromatic Demasking (Steps 2, 3, 4):
Step 2: Initial Color Shifts: Go to "Corrections" and apply the "Hue/Saturation" filter to globally shift the colors and isolate the target structures. (This filter forms Layer 2 and is applied over Layer 1.)
- Master Channel (8 colors, left circle): Hue: -180; Saturation: +100, Lightness: 0.
- Green Channel (4th circle from the left): Hue: +180; Saturation: 0, Lightness: 0.
Step 3: Contrast Separation: Go to "Corrections" and add a "Curves" adjustment layer. This layer lies above "Hue/Saturation Layer". Choose shape an double-curve in the RGB channel for separating dark tones.
The two control points must be set exactly:
- 1. Control Point: Input 4 / Output 120
- 2. Control Point: Input 41 / Output 41.
Step 4: Final Isolation/Demasking: Switch to Layer 2: The final chromatic isolation is performed in the cyan channel (5th circle from the left) on the same layer as in Step 2.
Important: Slowly move the Cyan Slider across the entire range (iteratively) while continuously observing the visual results. Refer to Table A.4 for the corresponding data.
Phase V: Measurement and Validation (Protocol Step 5)
- Placement of PSD files (Top Layer): To ensure correct placement, the PSD control files available on Zenodo must be placed on top of the working file using the "Place Linked" function (File → Place Linked).
- Disable the Template's PSD background layer (black): The PSD files are sometimes uploaded with a black base layer. This layer must be disabled.
- To do this, navigate to the layer of the PSD file.
- Right-click and select "Convert to Layers" and confirm all subsequent options.
- Now click on the folder containing the individual layers of the PSD file: Here, deactivate Layer 1. You should now only see the Template.
- Adjust Template Size & Fix Aspect Ratio: To adjust the template size, select "Edit" -> "Free Transform". You can now move the template freely. Before moving the template, the specified aspect ratio must be fixed. You can do this in the top toolbar, where there is a small rectangle ("Link Shape Width and Height") that must be activated.
- Coordinate Correction (Final): To compensate for systematic rotation errors, a coordinate offset is required. Apply the correction value Y: - 6 pixels (offset vector) to determine the final X/Y coordinate value.
Validation with manually created PSD templates: Same procedure as with the coordinate template. Control function using Figures 9.2.1 to 9.2.14:
To use these images as control elements, proceed as follows:
- Create a new layer that sits on top of all other layers. Activate this layer.
- Open the image you want to use as a control in Photoshop.
- Insert the control image using "Place Linked" (File → Place Linked).
- Resize the control layer using "Edit → Free Transform." Be sure to observe the specified aspect ratio, which can be locked in the top horizontal bar (activate the rectangular box).
- For the image to function as a control, its opacity (transparency) must be reduced, for example, to 50%. This option can be found in the Layers panel.
Extraction of Ocular Morphology: To ensure the metrological integrity of the results presented in the main analysis, the entire reproduction process for the pupil positions and further ocular morphology in Adobe Photoshop (version 26.11.0 or newer) is strictly formalized. The following video serves to provide transparent traceability and enables the verification of the protocol steps in accordance with Table A3.
Key Aspects of the Protocol:
- Systematic Image Processing: From file preparation to chromatic demasking (color channel isolation) and precise contrast separation using defined curve adjustments.
- Metrological Validation: By utilizing a verifiable coordinate offset and standardized control templates, it is ensured that the analysis is based on a reproducible workflow rather than subjective interpretation.
- Transparency: The integration of the PSD control files allows for the reproduction of the isolation of identified structures under identical conditions.
Note: The user interface of the program used (Adobe Photoshop) is set to German; however, the names of the work steps are listed bilingually (German and English) in the documentation for better international understanding.
Between Experience and Evidence
Welcome
This platform serves to deepen and verify a reality that is already a certainty for many: we are interacting with a multidiversity of non-human presences. While the general debate often still revolves around the question of existence itself, our work here focuses on objective documentation and analysis. We present the results of an independent scientific investigation that goes beyond mere indication. Through the metrological recording of Kumburgaz data within the framework of the main analysis and its comparison with a physical contact event of the author (1987), we transform subjective experience into quantifiable evidence. The purely visual initial investigation preceding the main analysis is presented here with fascinating results. This is a space for those ready to take the next step: moving away from the question of "if," toward an understanding of "what" and "how."
The Connection: Here, we bridge the gap between a direct encounter with a non-human intelligence (NHI) in 1987 and the world-famous UFO sightings over the Sea of Marmara (Kumburgaz, 2008). This does not necessarily involve a single, isolated species; the available observations suggest that we may be dealing with a diverse range of non-human presences. While various manifestations often remain fleeting or elusive, physically tangible types leave more distinct traces in our records. While viewing Murat Yalcin Yalman's photographs (2008), the author recognized, for the first time in more than three decades, signatures in still image 7 of a video sequence that she had already encountered in 1987: the striking silhouette, the dark skin tone, and the bright yellow eyes beneath a characteristically curved bony protrusion. Still image 7 was previously analyzed by Professor Mario Valdés from Chile in 2010. The general focus to date has been on the bright area of the image, in which Valdés was able to identify several figures. The features identified here are located in the dark image area in still image 7, which is presented in the following visual investigation.
The Scene in Focus: The material depicts the entity in a context that can be interpreted as a presumably clinical examination of a presumably human person in the foreground. While the biological processes—such as the intake of fluid to power the entity—demonstrate a functional necessity, the scene simultaneously highlights the documented medical interest of these intelligences in human physiology.
Ethical and Methodological Note: The initial investigation presented here and the subsequent main analysis are conducted with due respect for the interaction with a presumed human subject documented in the image under investigation. Both investigations strictly limit themselves to the objectivity of morphological features of the described entity against a dark background on the right side of the image space. The deliberately chosen, detached, and clinically descriptive tone serves the purpose of methodological integrity: given the extraordinary nature of the phenomenon, any subjective interpretation is avoided in order to prevent an anthropocentric distortion of the (visual) data and to meet the scientific requirement of maximum objectivity.
Quantifiable Evidence: From Art to Metrology: What began as subjective artistic processing has become hard evidence through a quantitative analysis (based on the preliminary work of Prof. Mario Valdés from Chile). The research results underscore the authenticity of the film material, recorded by M. Y. Yalman, and provide measurable physical evidence:
- Structural Analysis: The data indicate the existence of a Constructed Biological Entity (CBE). This exhibits a metrically almost perfect geometric positional stability of pupil positions and other eye structures within the examined image space. (Note: This designation is proposed as a classification in metric analysis and is used here.)
- Beyond Conditioning: The fact that the appearance of these beings (generally referred to as "Greys" or "biotechnological hybrids") seems alien is due to cultural conditioning. The findings regarding this studied species, classified as the "Great Greys," reveal a functional physiology. This is not about science fiction clichés, but about understanding a highly efficient, integrated biology.
Visual Documentation and Academic Context: The visual investigation conducted here, along with the main analysis, establishes a foundation for examining existing film footage using available technical means and for grounding the subject in an academic framework (main analysis). The CBE findings are unequivocal: this type of NHI exists and was present at the times documented. Combining the documented sighting, the personal close encounter, the primary metrological analysis, and the author’s medical perspective makes it possible to share the encounter and the findings as part of a reality from which no one need shy away. If one summons the courage to let human curiosity prevail over conditioned fears, this presence can be understood for what it is: part of a much larger, multidiverse fabric that confronts us.
I. Table of Contents
1 Early Documentation of the NHI Contact
2 Preliminary Analysis and Source Material (Kumburgaz UAP Case)
2.1 Prehistory, Analysis Materials and Preparations
2.2 The Original Image and Enlargements
2.2.1 The Source File and Source Image 7
2.2.2 Enlargements made of Source Image 7
2.3 Methodology of Exploratory Image Configuration
3 Detailed Investigation of Facial Morphology and Interacting Elements
3.1 Initial Visual Analysis of Eye Morphology and Template Developement
3.2 The Head — Position, Morphology and Light Reflections
3.3 The Nasal Structure
3.4 The Oral Structure
3.5 The Supply Unit (External Feeding Element)
3.5.1 Visual Analysis of the Tank (Area A)
3.5.2 Analysis of the CBE-Serving Supply Unit
4 Analysis Results and Outlook
5 References
II. List of Figures
Figure 2.1: The Source File of the Valdés´ Analysis (Source Image 7 in Focus)
Figure 2.2: Marking of the Bright Areas against a Dark Background
Figure 2.3: Display of the Magnification Step from 212% to 290%
Figure 2.4: Display of the Magnification Step from 212% to 396%
Figure 2.5: Display of the Magnification Step from 212% to 624%
Figure 2.6: Defined Region of Interest (ROI).
Figures 3.1 and 3.2: Initial Visual Assessment of Facial Morphology
Figures 3.3 and 3.4: Visual Evidence of Active Luminescence
Figures 3.5 and 3.6: Methodological Presentation and Contextual Comparison
Figures 9.1.1 to 9.1.14, Series A: Gallery 1
Figures 9.1.1 to 9.1.14, Series B: Gallery 2
Figures 9.2.1 to 9.2.14, horizontal alignment: Gallery 3
Figure 3.7: Hypothetical Head Positioning and Reflection Patterns
Figure 3.8: Reflections Localized on the Head Surface and UAP Downward Movement
Figures 3.9 to 3.13: Gallery 4
Figure 3.14: Focus on Oral Morphology
Figure 3.15: Differentiation of the Mouth Region and Light Reflection
Figure 3.16: A Striking Illustration of the Right Corner of the Mouth
Figure 3.17: Details of the Mouth Region and Morphological Analog
Figure 3.18: Individual Elements of a Supply Unit
Figure 3.19: Initial Identification and Localization of the External Structure (Tank)
Figure 3.20: Analysis of Two Artifact Types
Figure 3.21: Note on the Materiality of the Tank
Figure 3.22: Component Analysis: Tube (B) and Liquid (C)
Figure 3.23: The Liquid Medium (C) as the Transport Medium for the Energy Supply
Figures 3.24 to 3.38: Gallery 5
Figures 3.39 to 3.48: Gallery 6
III. List of Galleries
Gallery 1: Ocular Morphology (Series A)
Gallery 2: Ocular Morphology (Series B)
Gallery 3: Positional Constancy and Geometric Coupling
Gallery 4: Identification of Nasal Anatomy
Gallery 5: Comparative Documentation – Visual Evidence of the Liquid Phase (Area C)
Gallery 6: Context of the Energy Supply Process
IV. List of Abbreviations
CBE: Constructed Biotechnological Entity
MD: Microsoft Designer Tool
NHI: Non-Human Intelligence
ROI: Region of Interest
SD: Standard Deviation
UAP: Unidentified Anomalous Phenomena
1. Early Documentation of the NHI Contact
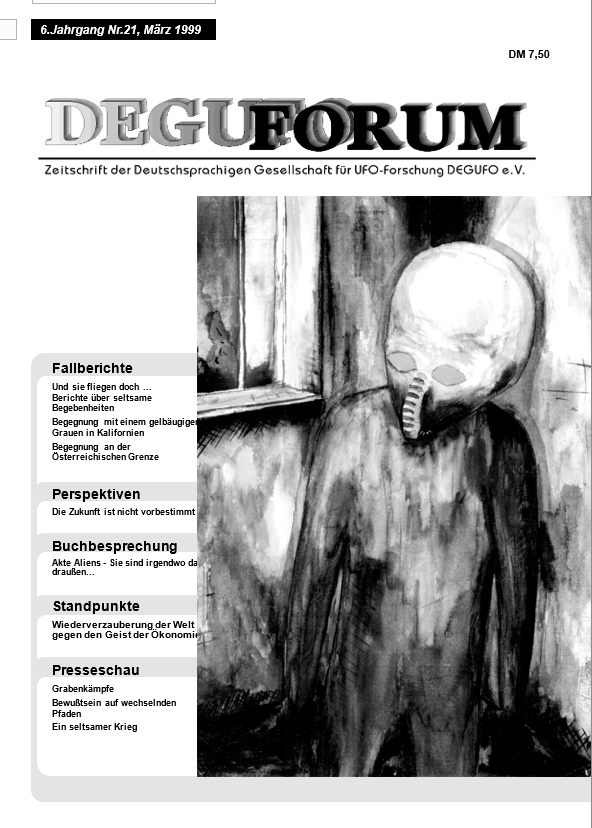
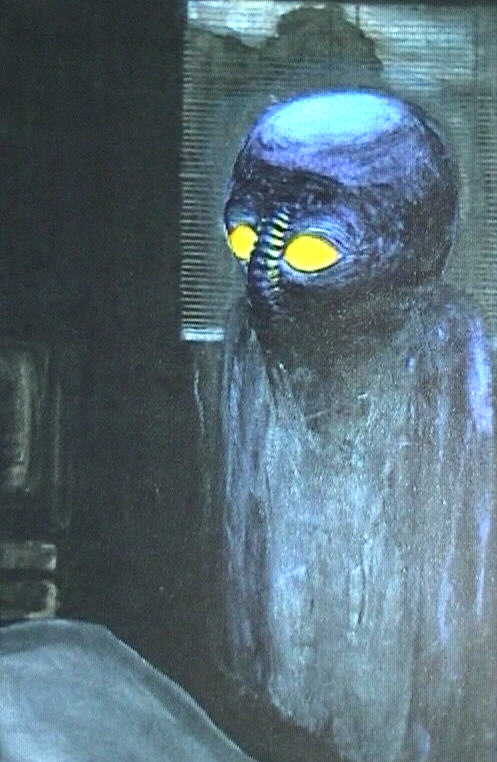
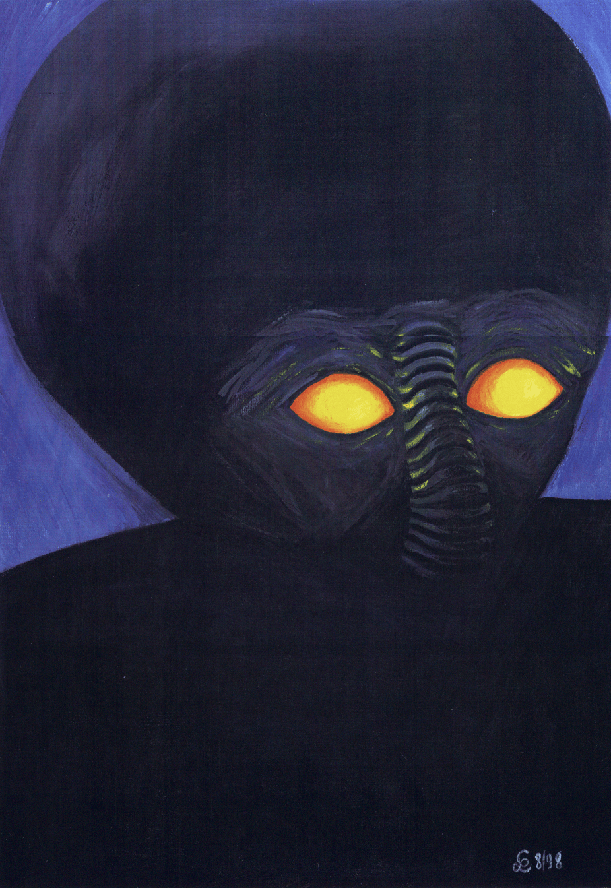
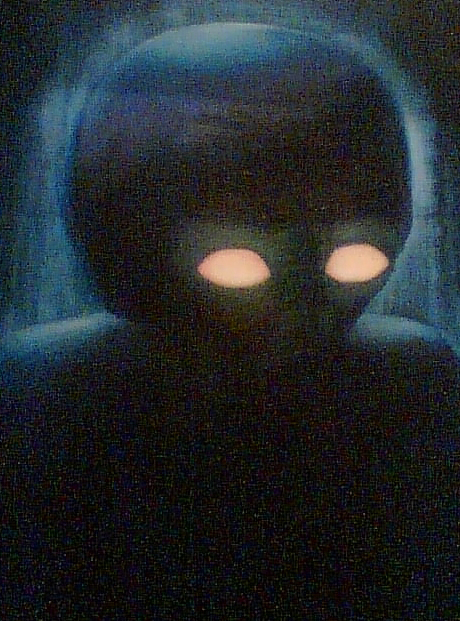
This gallery features paintings by the author, created from her memories of the event. They depict portraits of the entity and the situation at the time. Image 1 in the gallery documents a publication in a case-related issue of the journal DEGUFO from 1999.
Click for full size view.
Paintings of the 1987 NHI Contact in Sacramento, California
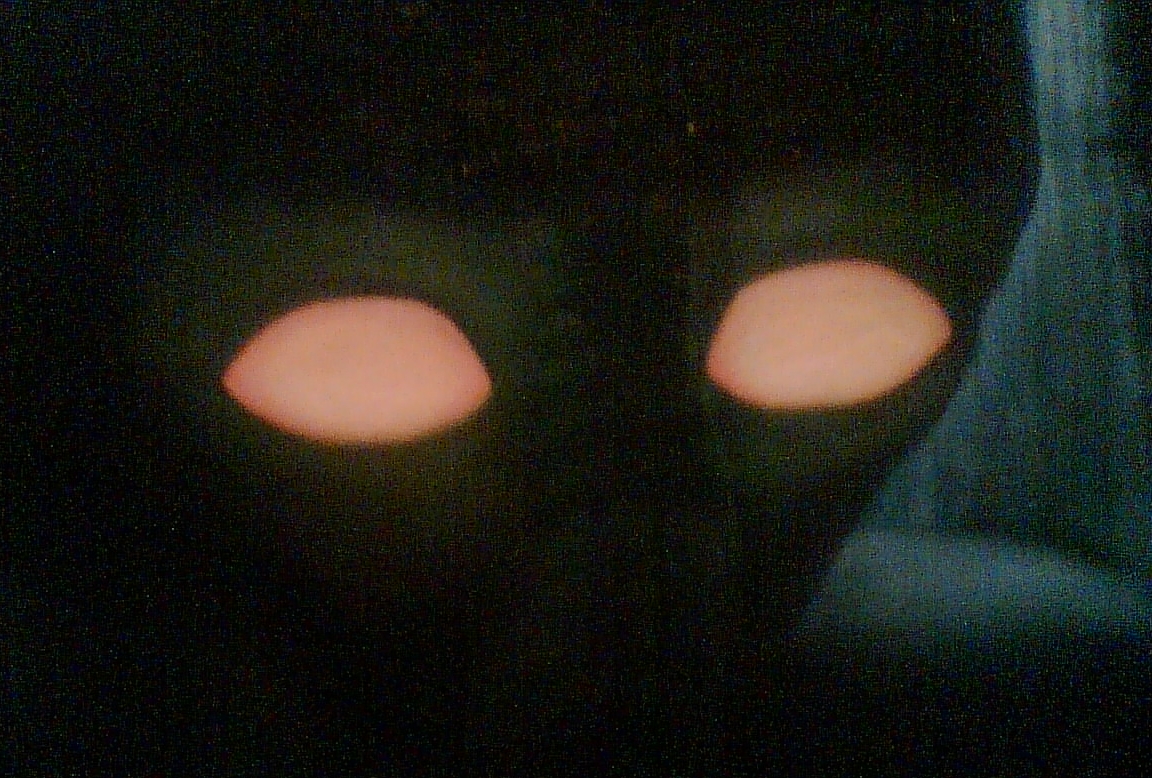
This series of paintings by the author depicts the direct encounter with an entity from 1987. These works are based on memories of the event. Some of these early works, created years before Yalman's (2008) photographs, are of particular relevance. When viewing them, note the characteristic Grey head shape and the luminous eyes. The center of the face differs structurally from the center of the face of the entity examined in Still Image 7 (Valdés, 2010).
The Situation: The author briefly describes the entire situation: "The event began around 12:15 a.m. I was lying awake, with my eyes closed, in the bed of my guest room when I suddenly heard a faint noise and simultaneously became unable to move. I managed to open my eyes twice with effort. The first time, I saw a humanoid entity standing in front of my bed, looking down at my body. Figures 12 and 2 show the situation approximately as I opened my eyes the first time. The second time, the entity was standing in the middle of the room, looking towards the door (Figures 3, 4, and 5 as a portrait). For me, the entire situation lasted from seconds to a few minutes. When the entire situation was over, I looked at the clock, which showed 1:30 a.m. The discrepancy between the elapsed time of more than an hour and the seconds to a few minutes I experienced while awake only became apparent to me years later, after the timeline had been reconstructed."
Position, lighting, and inference regarding active luminescence: The author's encounter took place after artificial light sources had been switched off (approximately 00:15). Subsequently, some moonlight (waning moon) may have slightly illuminated the room. Based on this information, active luminescence of the eyes can be assumed, which corresponds with the findings in source image 7. All images show, within the context of the author's respective artistic development over time, the position from which she saw the entity from her bed.
Documentation of Figures 1 and 2: These paintings, created in the early 1990s, are qualitative, original evidence of direct NHI contact corresponding to the Grey typology.
- Figure 1 (DEGUFO IMAGE): Early evidence from 1987 was published as part of a case report in the journal of DEGUFO e.V., issue no. 21, March 1999. This watercolor depicts the approximate position when the author was first able to open her eyes; the NHI's head is turned towards the bed. The "skin color" in this image does not correspond to the actual perceived color, which is a dark blue-gray.
- Figure 2: This image is in the author's possession. Its age could be forensically examined, possibly 1994.
Documentation of the Portraits - Figures 3, 4, and 5: These portraits document the head and face of the entity as the author saw it during the second visual viewing, while the entity was looking towards the door. Figure 3 dates from 1998, while the later painting (Figures 4 and 5) was probably created around 2006–2008.
- Documentation Context (Figure 3): Another portrait from the same period (early 1990s), which the author painted and dated by hand, confirms the continuous artistic documentation of this NHI contact. Although this dated original is unfortunately no longer in her possession—it was given away.
- Visual Analysis (Figures 4 and 5): The author describes this later portrait (Figure 4; Figure 5 corresponds to as an enlarged crop of Figure 4) as "similar to a photograph." Despite the dark room (without artificial light sources), facial features were partially visible due to the actively glowing eyes and could be documented by the author.
2. Preliminary Analysis and Source Material (Kumburgaz UAP Case)
2.1 Prehistory, Analysis Material and Preparations
Prehistory: The original contextual video recording, captured by Murat Yalcin Yalman at 3:54 AM on June 8, 2008, from Kumburgaz, documenting a UAP (Ultra-Airborne Phenomenon) over the Sea of Marmara at a distance of several kilometers, was initially examined under the direction of Haktan Akdogan of the SIRIUS UFO organization. Both the Turkish Institute for Scientific and Technological Research (TÜBİTAK) and international video experts from Japan, Russia, and Turkey confirmed the authenticity of the footage.
In 2010, graphic designer and video expert Professor Mario Valdés from Chile conducted a thorough analysis of the videos to rule out any possible forgeries. He employed zoom, frame-by-frame manipulation, and photogram creation. Valdés also concluded that the footage was authentic, showing objects with occupants. He ruled out the possibility that the objects were computer animations, 3D renderings, dummies, or models. Valdés' conclusion is: "My conclusion is that this case, up to this point, is a real, highly unusual event ... for which there is no conventional, convincing and provable explanation, and which is therefore not identified to my knowledge.".
Foundation of the Further Investigation and Metric Analysis: Preparation by Prof. Valdés: The investigation is based on video recordings from 2008 (Yalman). Based on specialized technical analyses, it is assumed that the configuration utilized a tripod-mounted camera (analogous to Canon GL1 or GL2 series models) in combination with an optical teleconverter system. This setup enabled an optical magnification of up to 200x. As there is no reliable official primary source regarding the recording equipment for 2008, this study does not commit to a specific model designation. The recording system preserved the physical image data on analog cassette tapes, thereby fully ensuring the necessary level of detail and native pixel integrity.
On this basis, Valdés (2010) performed further digital enlargement and brightness adjustments to reveal the structural details for his analysis. A crucial aspect of the data preparation in Valdés' analysis was the need to drastically reduce the playback speed in order to isolate individual frames. This necessity arose because, according to Valdés, the "objects" in the foreground of the UAP "...move extremely fast, as if the video were being played back at maximum speed. Only by reducing the playback speed is it possible to recognize the objects and their movements...".
Prof. Valdé's professional preparation led to the visualization of pre-existing morphological structures. In the course of the investigation and analysis conducted here, two striking, bright yellow areas against a dark background were identified, which were already visible without digital brightening. Throughout this entire process, strict measures were taken to ensure that the morphological integrity of the source material was fully preserved and that no structures were added, altered, or removed. This preliminary work and the provision of the material for scientific purposes form the direct empirical basis for both the present analysis and the visual investigation presented on this website.
2.2 The Original Image and Enlargements
The following figures show the original image (Fig. 2.1, source file with image composition 7, 8 and 9) modified by Valdés (2010) from video sequences (Yalman, 2008), which he used in his analysis of the Kumburgaz case, and the source image 7 isolated from it. Note: Due to the modification by Valdés, the source file and the modified still image 7 are referred to as Source file and Source image 7.
2.2.1 The Source File
Figure 2.1: The Source File from the Valdés Analysis (Source Image 7 in Focus)
The source file underlying this investigation is a compilation of the original still images 7, 8, and 9, which Valdés selected and prepared for his video analysis (cf. Section 2.1). The source file is in JPEG format and is displayed here in lossless PNG format for this exploratory analysis. The investigation conducted here—which is tailored to the analysis results—focuses on source image 7, located on the left side of the figure. The source file was displayed in Windows Photo Viewer in full-screen mode at a scale of 212%.
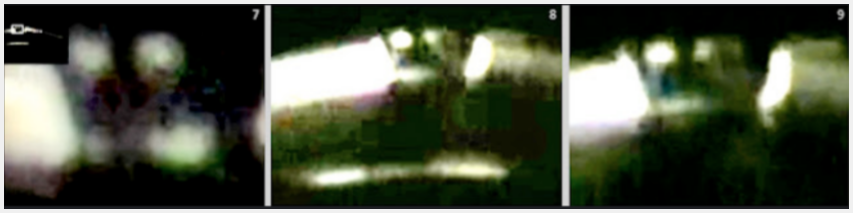
Figure 2.2: Marking of the Bright Areas against a Dark Background
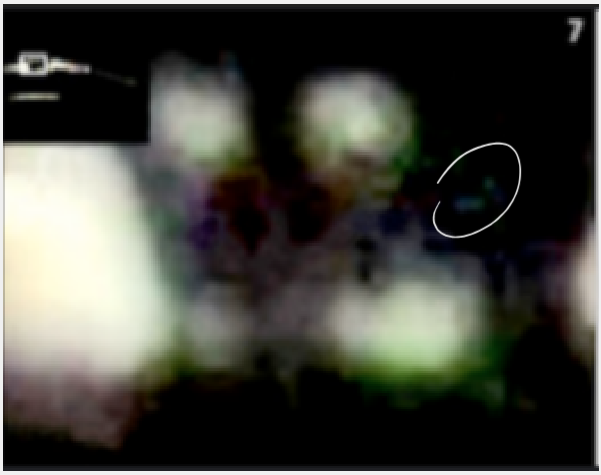
Upon examining source image 7, the author first noticed two bright areas in the dark background (on the right side of source image 7). These anomalies have been marked in white to highlight them. Due to the striking shape and brightness of this anomaly, a decision was immediately made to enlarge the still image. Although the author was familiar with the Kumburgaz video footage, the signature of the luminous areas was only noticed during a detailed review of the material in 2023, as the focus had previously been on the figures in the foreground. Technical details: This figure shows the cropped source image 7. The marking serves to highlight the bright areas against the dark background.
2.2.2 Enlargements made of Source image 7
This section shows the successive magnification of Source image 7 and defines the relevant region of interest (ROI).
Figures 2.3 to 2.6 document the consecutive magnification steps (212% to 957%) that lead to the definition of the relevant region of interest (ROI). Any digital post-processing (brightness, contrast, etc.) is avoided. The visible morphological details are created exclusively by the optical magnification of the image section.
- The magnifications are performed using Windows Photo Viewer.
- Please note that all images displayed on the website (originally JPEG) are shown in the lossless PNG format. Since PNG is a lossless format, the existing image data is neither distorted nor altered.

Figure 2.6: Defined Region of Interest (ROI)
This image represents the starting point of the actual image investigation. It shows the defined ROI at magnifications ranging from 212% to 957% (based on the preliminary work of Valdés). Up to this point, no further image processing (brightness, contrast, etc.) has been performed. The chosen magnifications alone already provide initial insightful details.
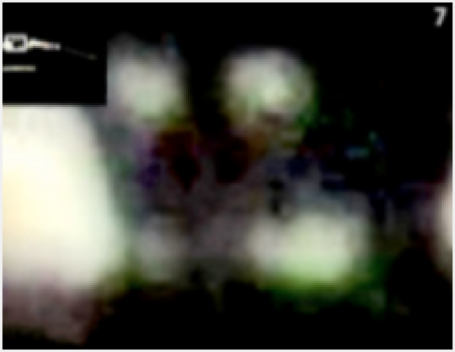
Figure 2.3: Display of the Magnification Step from 212% to 290%.
Figure 2.4: Display of the Magnification Step from 212% to 396%.

Figure 2.5: Display of the Magnification Step from 212% to 624%.
2.3 Methodology of Exploratory Image Configuration
Methodological Implementation (Tools and Parameters): The following section summarizes the methodological principles and details regarding the tools used.
Principles of Structure Identification: The identification of details, structures, and morphological features (anatomical analogs) is based on the following fundamental principles:
- Visual Pattern Recognition: The identification of a morphology (anatomical analog) or structure is achieved by comparison with known patterns.
- Confirmation through Repitition: Identified patterns appear repeatedly with different combinations of image adjustments (configurations).
- Reproducibility: Patterns of morphological structures can generally be reproduced despite the proprietary image processing algorithm of the Microsoft Designer tool. Exceptions to this (e.g., pupils and limbus, which are obscured due to the eye's internal luminescence) require a special reproduction method.
Graphical Verification of Structures
- Determination of positions using reference/intersection points, horizontal and vertical lines.
- Comparison and differentiation of structures and their feature characteristics (size, orientation, color values, etc.).
Note on Reproducibility: Although the findings presented here are regarded as hypotheses—since they are based merely on visual assumptions derived from a proprietary algorithm (processing via the Microsoft Designer tool)—one point should be stated at the outset: the biological and structural morphology presented here is fully reproducible, thereby confirming the purely visual results. As the initial examination documented here utilized the Microsoft Designer tool, that analysis and its associated images have been retained. Due to time constraints, a scientifically rigorous elaboration (involving quantifiable reproduction) using professional image-processing software has been omitted. The priority of the entire documentation regarding this entity in source image 7 is the metric evaluation of the morphology under investigation—specifically the pupil positions and their reproducibility—within the main analysis.
Documentation on Tools Used and General Notes
- Tools Used: Windows Photo Viewer and Microsoft Designer (MD). These tools are used for the following editing tasks: image configurations (as specified below), cropping, marking, labeling, and collage creation.
- Image Configurations using the "Microsoft Designer" Tool: Image configurations are performed using the Microsoft Designer editing tool.
- Parameters Applied in MD: Editing was carried out exclusively through the successive application of the following six configuration options: brightness, contrast, saturation, shadows, color temperature, and sharpness.
- Reproducibility: The configurations performed here using Microsoft Designer yield visual results (e.g., facial contours, eye outlines, interacting elements); however, the precise algorithms governing the configuration options (such as image modifications via brightness reduction, etc.) remain unknown due to the proprietary nature of the algorithm employed by Microsoft. Nevertheless, most of the resulting images can be reproduced using the tool in question. A specific exception is the reproduction of the pupils and limbi (indicating the cornea and underlying iris) identified within the eyes; a reproduction protocol for these features is already available (see above for links to the main analysis and the accompanying video tutorial). Professional reproduction of the identified supply system (see section 3.5 onwards) would be of interest, but this has been omitted here due to time constraints.
- Documentation of Reproduction Parameters: To ensure interdisciplinary reproducibility, the respective figure captions document a detailed, purely visually based interpretation of the identified morphology or structures, the classification based on configuration (effects), and the specific reproduction parameters applied (brightness, contrast, saturation, shadows, color temperature, and sharpness) for the corresponding image or image series (gallery).
- Image Labeling: Image labeling is provided in English.
- Region of Interest (ROI; cf. Fig. 2.6): The subsequent images (with the exception of Figs. 9.1.1–9.2.14) are based on the defined area of examination (Fig. 2.6), although in some cases further magnifications are applied and/or the images are shown cropped.
- Note on Terminology (Analogous Use of Morphological Terms): All morphological and structural terms used in this purely visually based treatise (including "pupil," "cornea," "limbus," "limbal ring (shadow)," "iris," "margo palpebralis superior" [upper eyelid margin], "bulbus segment," "reflection," "object," "tank," "tube," and "fluid") are used exclusively as analogous descriptions and classifications of observed image structures. Consequently, these terms refer to purely visually identified analogs of potential biological and structural signatures.
- Image Orientation (Visual convention):
a) Fig. 9.2.1 - 9.2.14 & further Illustrations: The eye analogs are aligned on a horizontal axis because the original image (Fig. 2.6) was rotated 58° clockwise for better perception. According to anatomical convention, from the viewer's perspective, the right eye analog is on the left of the image, while the left eye analog is on the right.
b)Fig. 2.6 (the ROI): The eye analogs retain their original oblique orientation in this original image; the eyes are not aligned on a horizontal line. The right eye analog is located in the lower left of the image, while the left eye analog is located in the upper right of the image.
3. Detailed Investigation of Facial Morphology and Interacting Elements
The following images present the visual findings obtained during the initial examination for the main analysis. This exploratory phase relied on the targeted chromatic enhancement of existing morphological facial features and other structures within the defined ROI (see Fig. 2.6), utilizing the freely accessible Microsoft Designer editing tool. The visual interpretations—or the results consistent with the main analysis—are presented in separate sections for greater clarity.
Overview
3.1 Initial Visual Analysis of Eye Morphology and Template Developement
3.2 The Head — Position, Morphology and Light Reflections
3.3 The Nasal Structure
3.4 The Oral Structure
3.5 The Supply Unit (External Feeding Element)
3.5.1 Visual Analysis of the Tank (Area A)
3.5.2 Analysis of the CBE-Serving Supply Unit
List of Galleries
Gallery 1: Ocular Morphology (Series A)
Gallery 2: Ocular Morphology (Series B)
Gallery 3: Positional Constancy & Geometric Coupling
Gallery 4: Identification of Nasal Anatomy
Gallery 5: Comparative Documentation – Visual Evidence of the Liquid Phase (Area C)
Gallery 6: Context of the Energy Supply Process
3.1 Initial Visual Analysis of Eye Morphology and Template Development
This section focuses on the exploratory visual analysis of the eye region (eye morphology), which was identified as humanoid-like and became the primary target for the subsequent metric analysis (see link to main analysis, top of page). The images allowed for visual interpretations through the use of configuration parameters (brightness, contrast, saturation, shadows, color temperature and sharpness), enabling detailed delineation of the relevant morphological structures.
Collage with Figures 3.1 and 3.2: Initial Visual Assessment of Facial Morphology
- Figure 3.1 (left): This image (Fig. 2.6, ROI) serves as a comparison in its unprocessed state and is displayed in the Windows Photo Viewer in editing mode. Image artifacts (e.g., grid lines) are visible.
- Figure 3.2 (right): Initial configuration of the ROI: Brightness adjusted to 60%. Configuring the ROI allowed for an initial visual identification of a humanoid-like head. The bright areas in Fig. 3.2 are interpreted as eyes in the morphological context of the humanoid-like head, the delineation of which requires precise visual analysis. Technically, it should be noted that the MD tool used here already exhibited improved image processing (reduced pixel artifacts) during saving compared to the reference image Fig. 3.1.
Configuration Parameter for Fig. 3.2: Brightness: 60%.
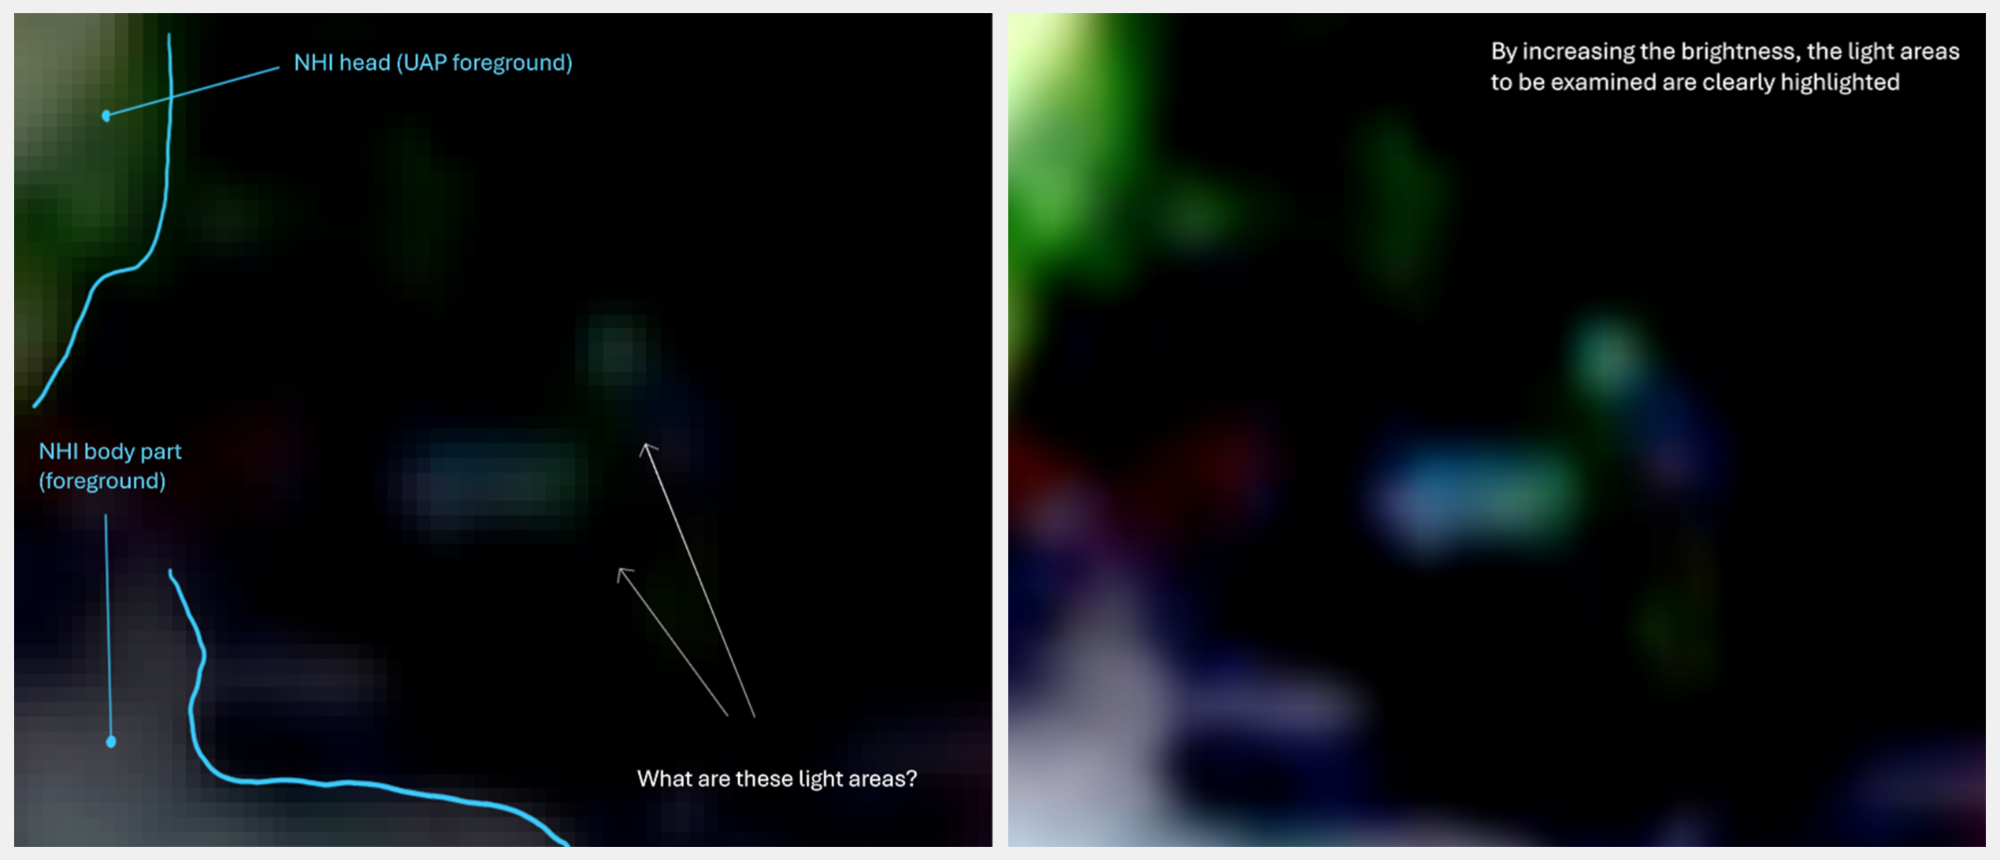
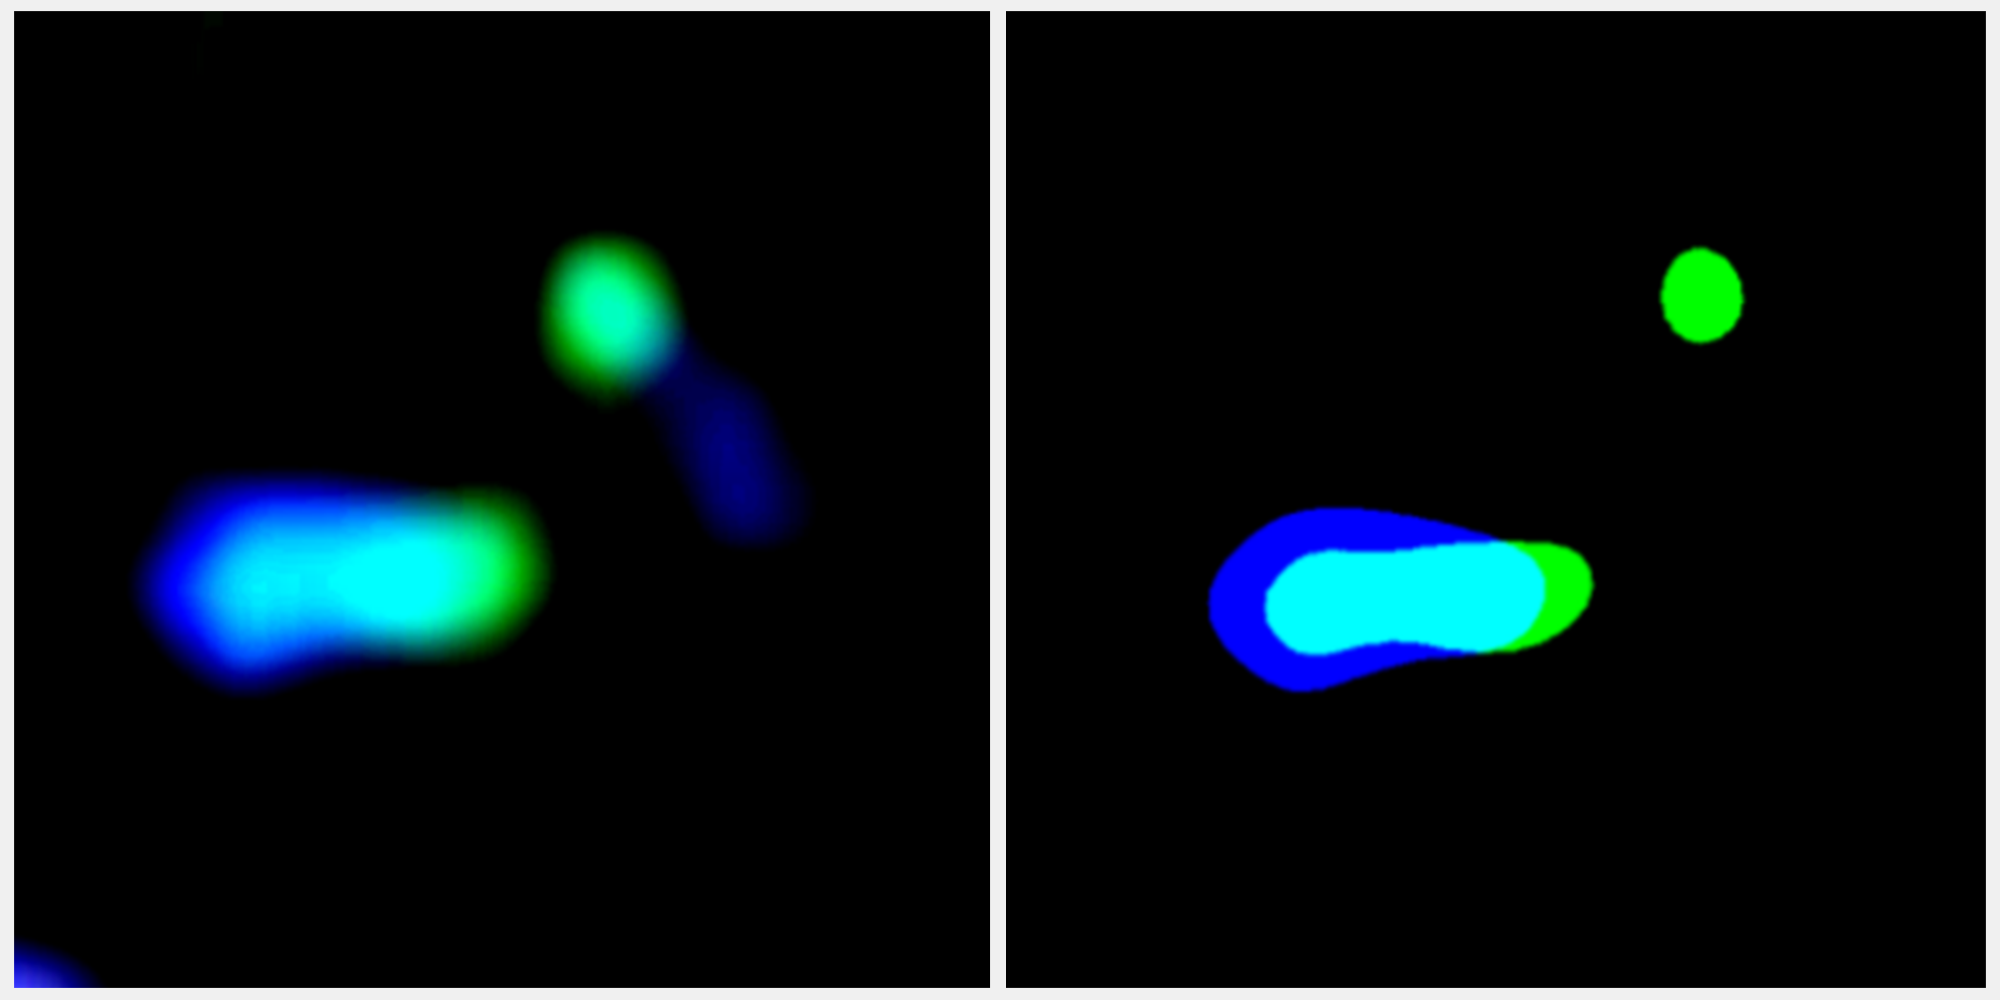
Collage comprising Figures 3.3 and 3.4: Visual Evidence of Active Luminescence: This collage illustrates the apparent inherent luminescence of the eyes through the application of configuration parameters. Comparing the two representations, the shape of the right eye appears indistinct in Figure 3.4, as it forms a homogeneous color area with the surrounding reflections; in Figure 3.3, however, the almond-shaped structure of the eyes is clearly distinguishable from its surroundings. In both images, the right eye appears larger than the left eye. This appearance is due to a reflection located laterally to the right eye, which also overlaps with the left eye. This morphology was metrically confirmed in the main study. Nevertheless, it is visually evident in Figure 3.3 that the active luminescence can be distinguished from the lateral reflection. The reflection is primarily caused by the bright UAP foreground (incident moonlight with a presumably open foreground). This distinction is supported by the entity's positioning, as the right eye is positioned closer to the UAP foreground or open area, while the entity's head appears turned away and slightly raised.
Configuration Effect: The configurations used in the respective images show different color ranges in the right eye region. In Figure 3.4, the active luminescence of the right eye and the lateral reflection represent a single color range. In Figure 3.3, the right eye stands out in bright contrast to the lateral reflection. The blue coloration visible in both images is attributed to the lateral reflection, which is interpreted as an attenuation of the light.
Configuration Parameters:
Fig. 3.3: Brightness: 77%, Contrast: 65%, Saturation: 40%, Sharpness: -35%.
Fig. 3.4: Brightness: 75%, Contrast: 100%, Sharpness: -30%.
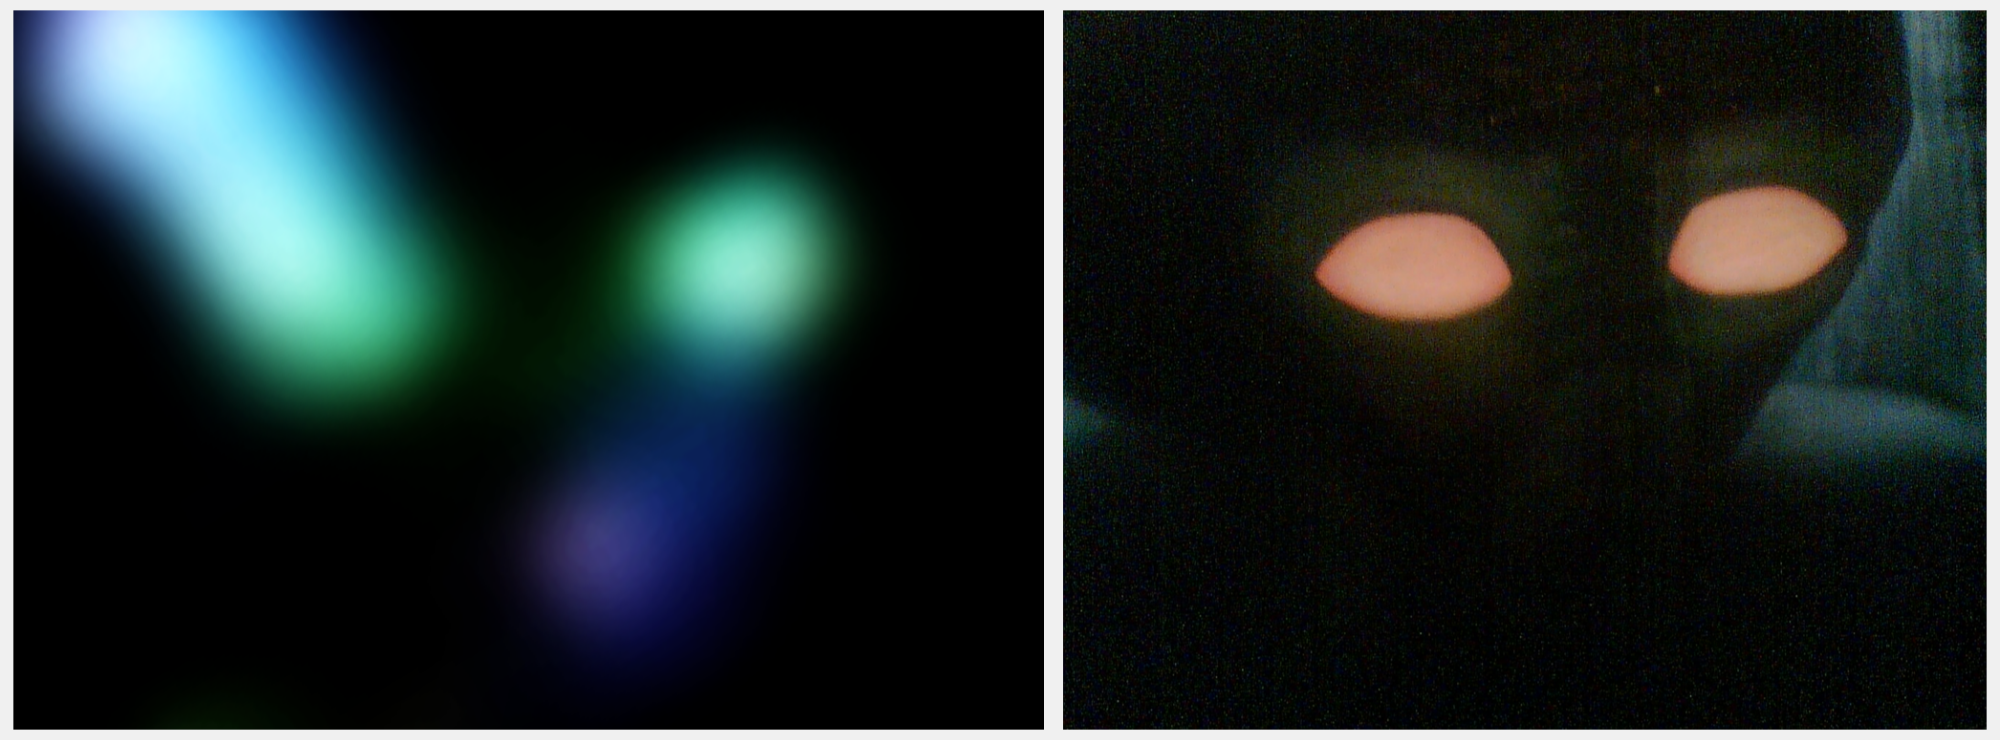
Figures 3.5 and 3.6: Methodological Presentation and Contextual Comparison
Figure 3.5 (left), which was rotated by 58° for a horizontal orientation for the investigation, again emphasizes the intrinsic luminosity of the eyes through the reproduction parameters used and confirms their almond shape despite the structural blurring. Figure 3.5 shows further structures.
Contextual Comparison with Figure 3.6 (right)—a Painting Resembling a Photograph: The eye structures of the entity in source image 7 (Fig. 3.5) are compared with a painting resembling a photograph—created from the memory of a close encounter in 1987 (cf. Section 1, Fig. 5). It is assumed that both entities belong to the same type.
- Morphological Correspondence: The dark skin tone—visible during the 1987 encounter due to the actively glowing eyes—appears identical to that of the entity in Source image 7. The binocular, frontally aligned eyes appear identical in both their almond shape and their size relative to the head.
- Non-identical Features: Two striking features observed during the 1987 encounter and depicted in the painting are absent from Source image 7: a blue-white, transparent corona (surrounding the entire entity) and a mask-like or breathing apparatus in the center of the face (hypothesis).
Configuration Parameters for Fig. 3.5: Brightness 84%, Contrast 31%, Saturation -47%, Sharpness -26%.
Initial Visual Evidence: Identification of Pupils and Limbi as the Basis for the Subsequent Main Metric Analysis
The visual results of this initial examination were obtained by processing the data with the MD tool using a proprietary algorithm. Despite this proprietary basis, the configurations applied enabled the identification of a morphology indicative of biological structures. Fourteen images were generated using various configurations (samples), in which the pupils of both eyes and a limbus in the right eye are visible. It was only through this clear visual evidence that the overarching structure of a humanoid-like face could be substantiated. These identifications serve as the visual foundation for the subsequent metric main analysis (see reference at the top of the page).
Gallery 1: Ocular Morphology (Series A)
This series of images (Figs. 9.1.1–9.1.14, Series A) presents fascinating details revealed through the exploratory combination of various configuration parameters (random combination). This process allowed for the identification of structures that had previously been obscured by intrinsic luminosity (luminescence). These newly revealed details strongly suggest the presence of pupils surrounded by a limbus ring (or the shadow of a limbus ring) within the eyes.
The results derived from the random combination of configuration parameters were obtained by processing the data with the MD tool using a proprietary algorithm. Despite this proprietary basis, the aforementioned biological structures were successfully identified across the 14 samples. The very uncertainty surrounding the unknown MD algorithm served as the catalyst for the subsequent metric main analysis, which aimed to quantitatively verify the distinctive morphological findings and ensure reproducibility. Regarding the visual findings presented here, the following should be noted: The specific configuration parameters can be found in the respective figures.
Notes on Figure 9.1.1:
- Left image: The ROI (see Fig. 2.6) as an overview with the applied configuration parameters (inset).
- Middle image: A magnified view of the ROI.
- Right image: The final magnification for series A.
- Video documentation of the reproduction process of Figure 9.1.1 (or 9.2.1): The video demonstrates, using image series A as an example, the unmasking of the pupils and limbi by applying the corresponding configurations. The video is located below Gallery 1.
Figures 9.1.2–9.1.14: These figures show a magnified view cropped to the ROI and document the applied configurations on the right.
Note on the applied configurations: Due to the significant results of the randomly selected configurations, the applied parameters are integrated into the images in the following order from top to bottom: Brightness, Contrast, Saturation, Highlights (was not applied), Shadows, Sharpness.
Note: It should be noted that the randomly combined configuration parameters do not guarantee a reproducible result when the process is repeated, due to the unknown algorithm and other technical parameters (e.g., internet speed).
Click for full size
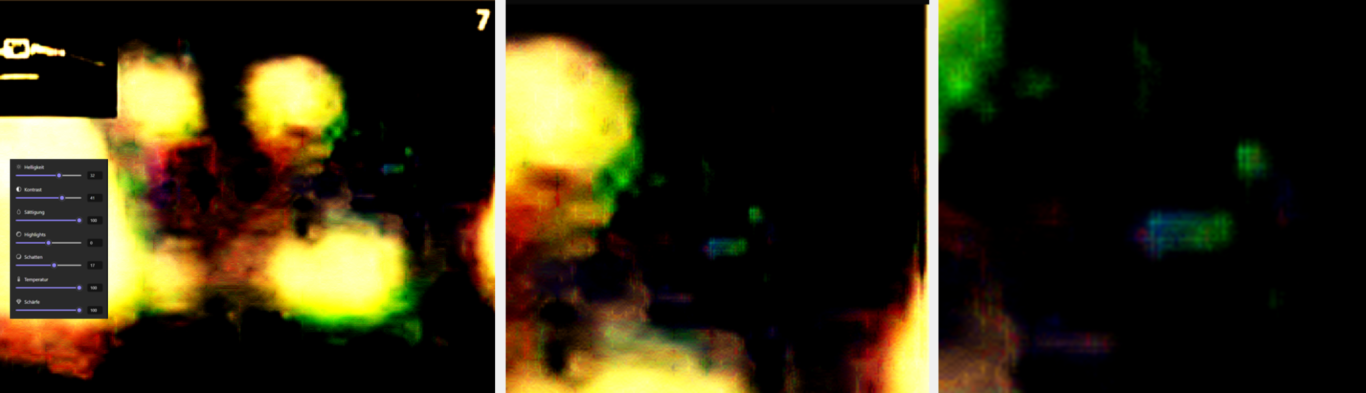
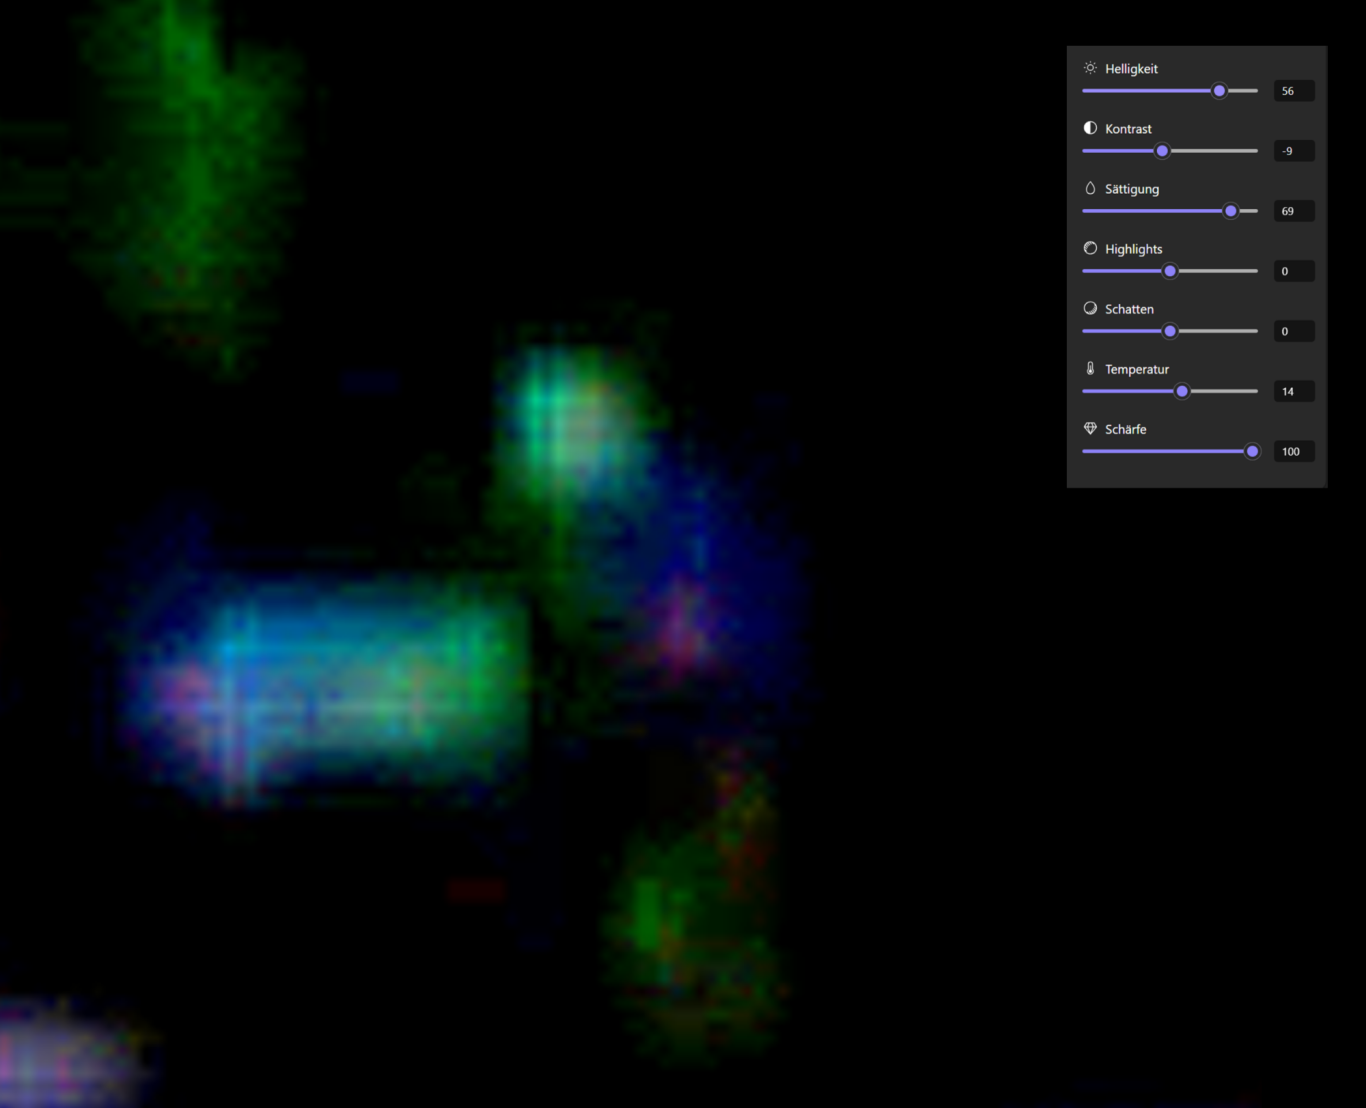
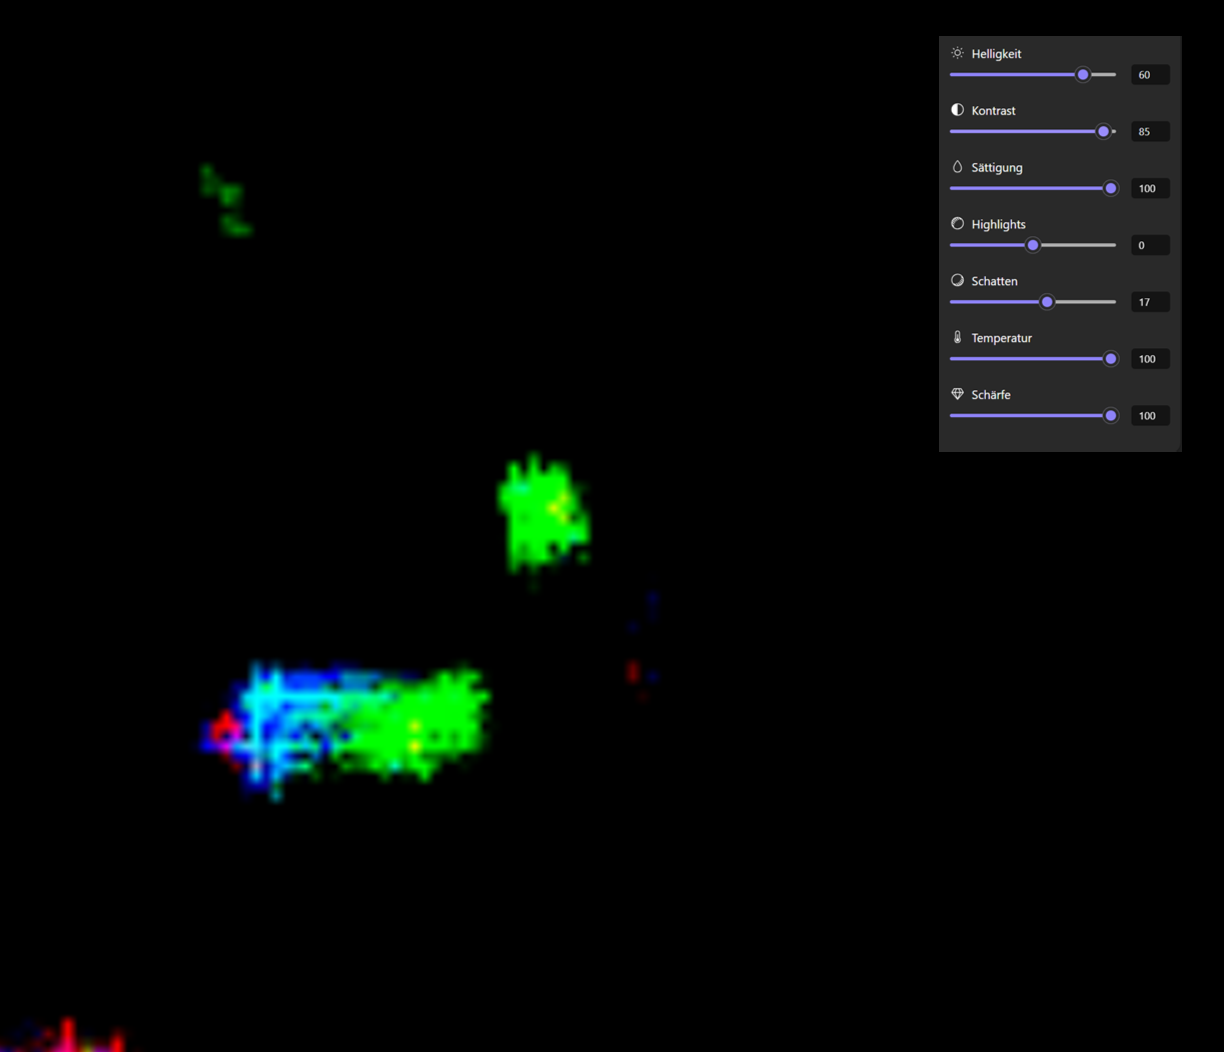
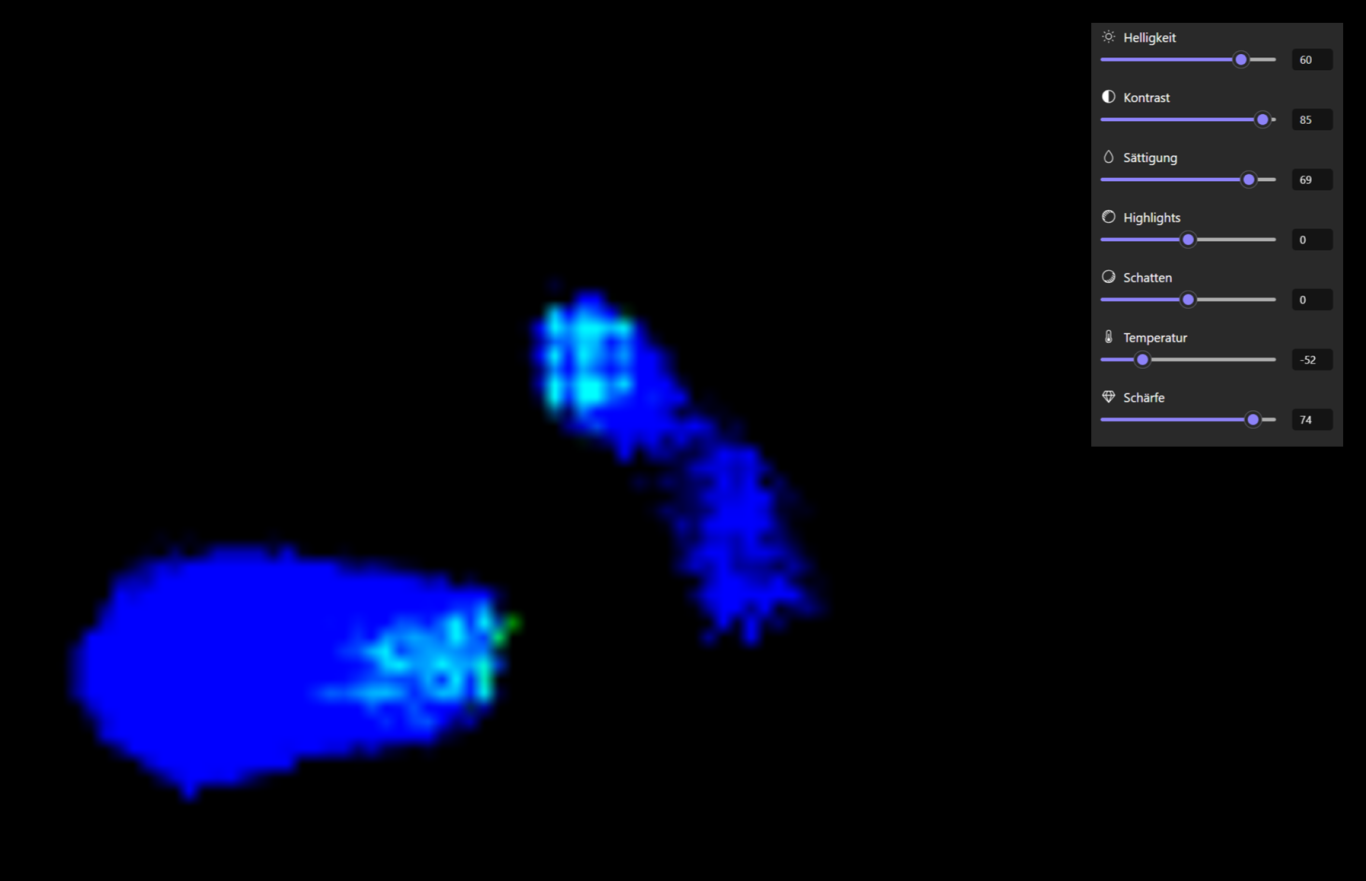
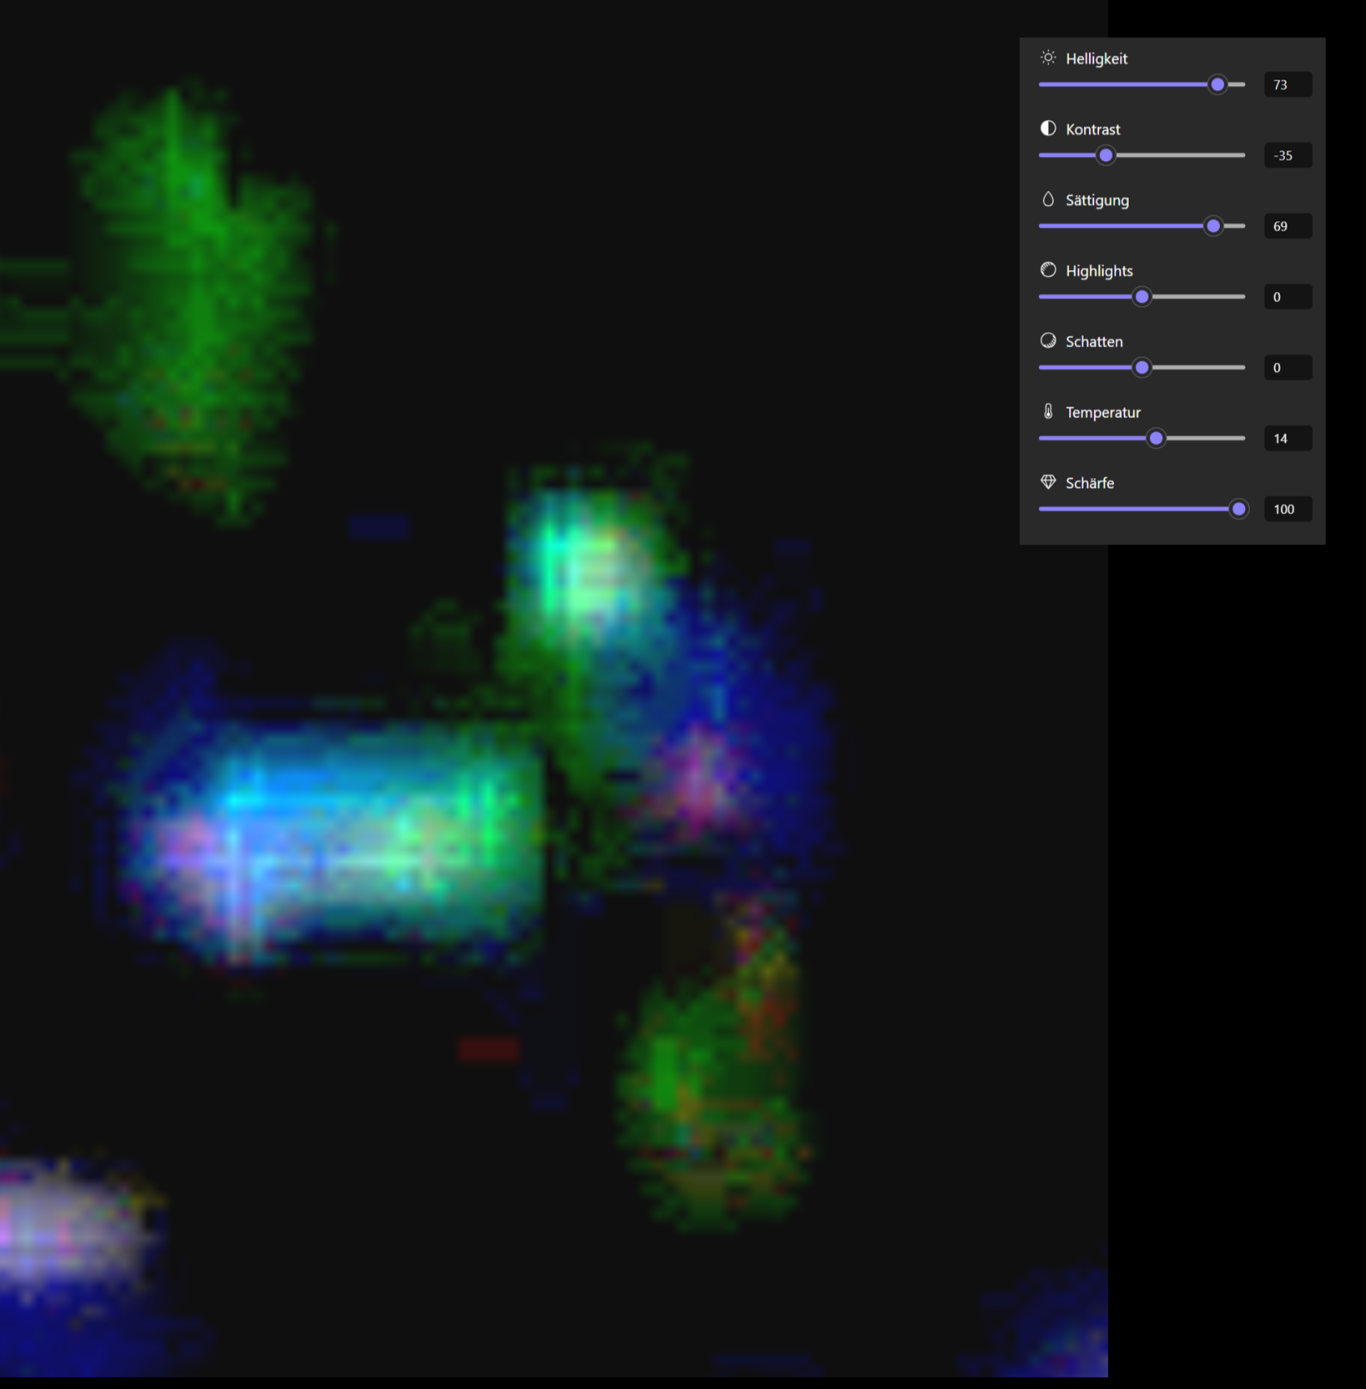
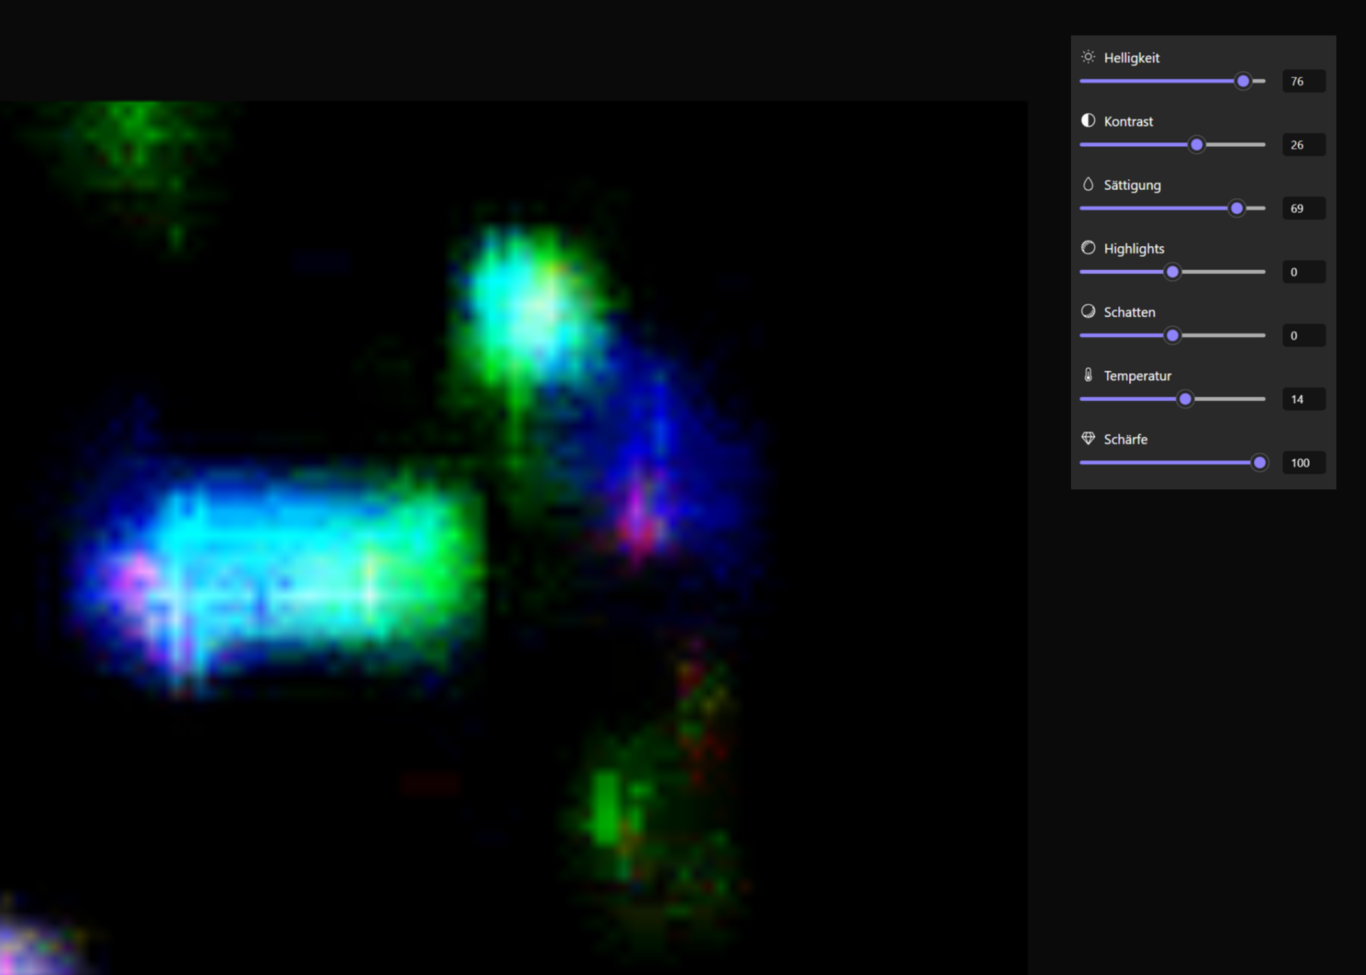
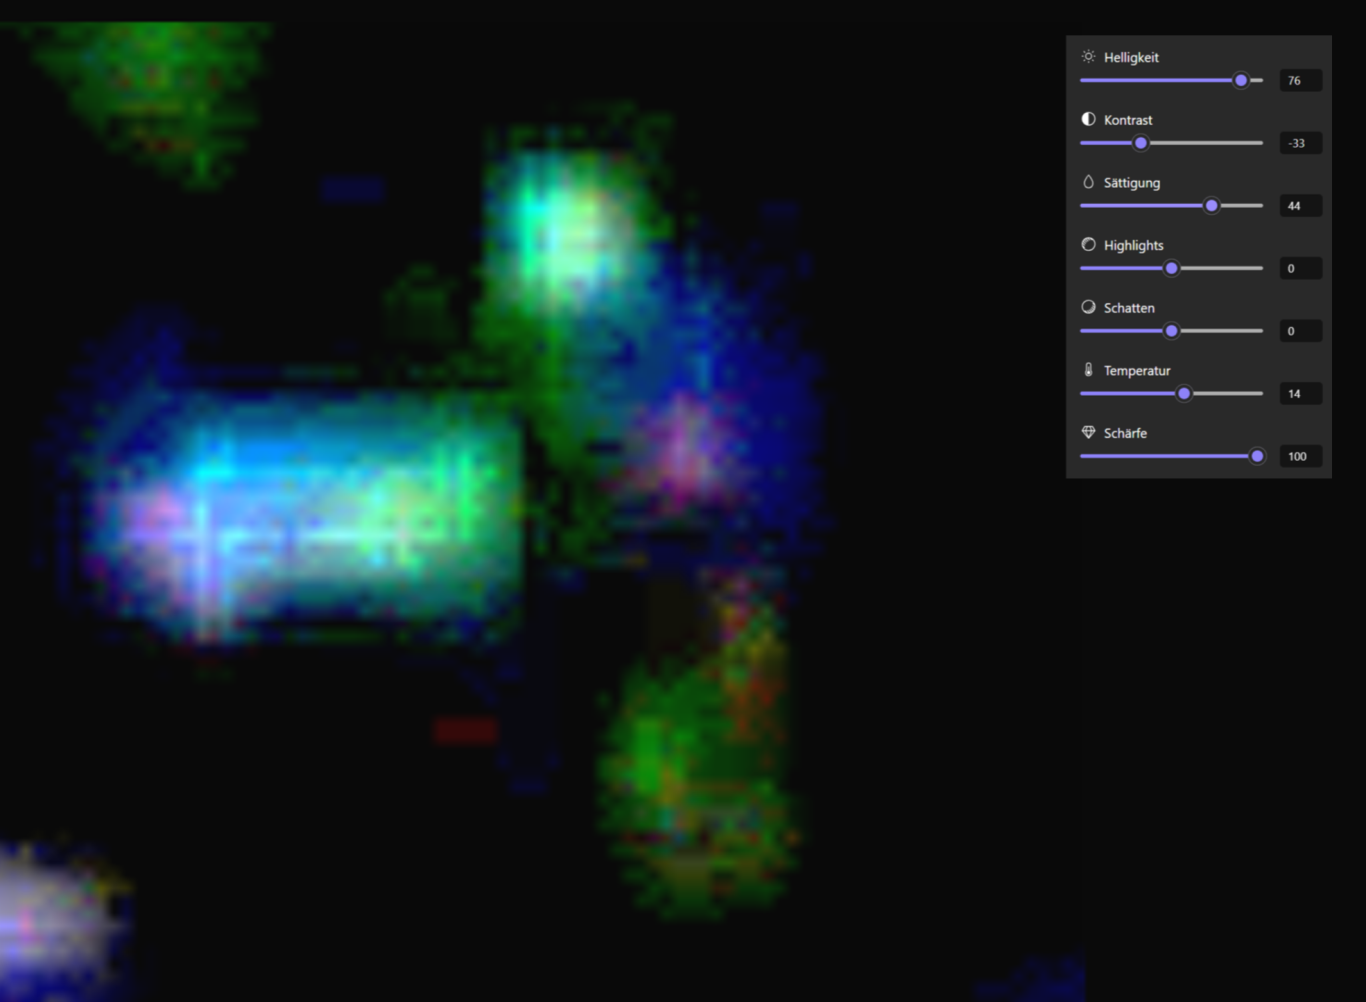
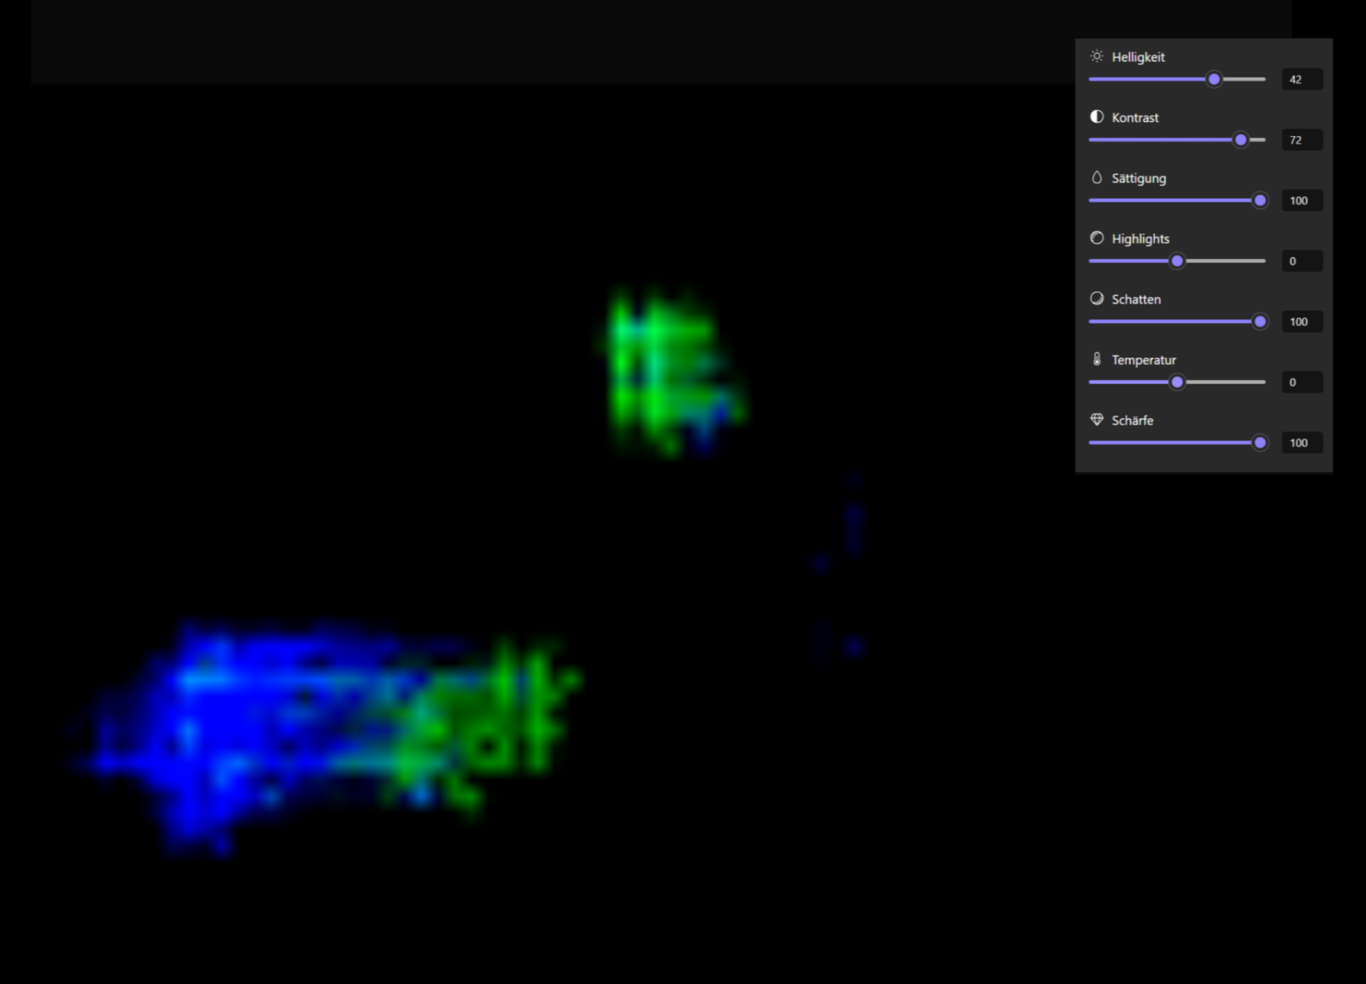
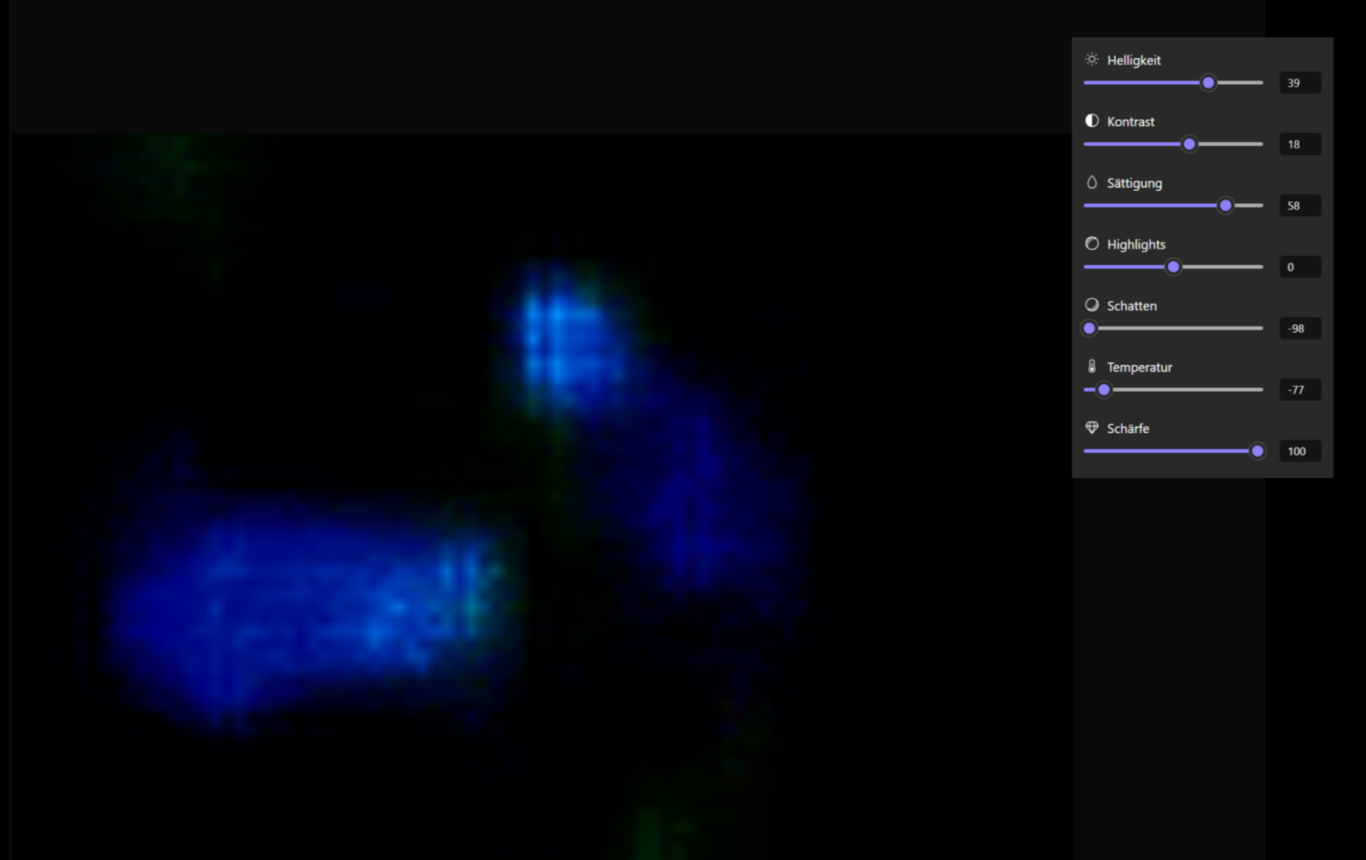
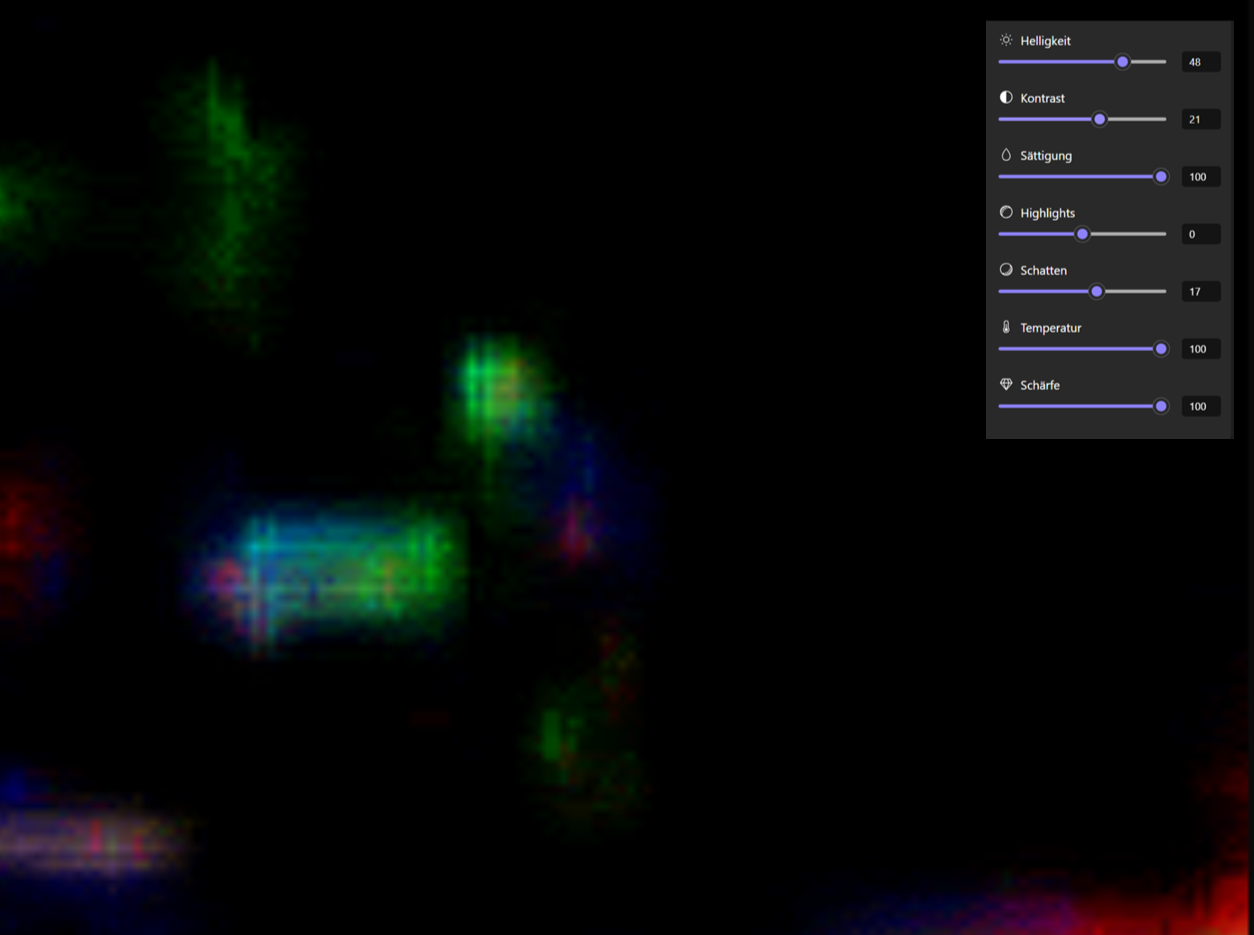
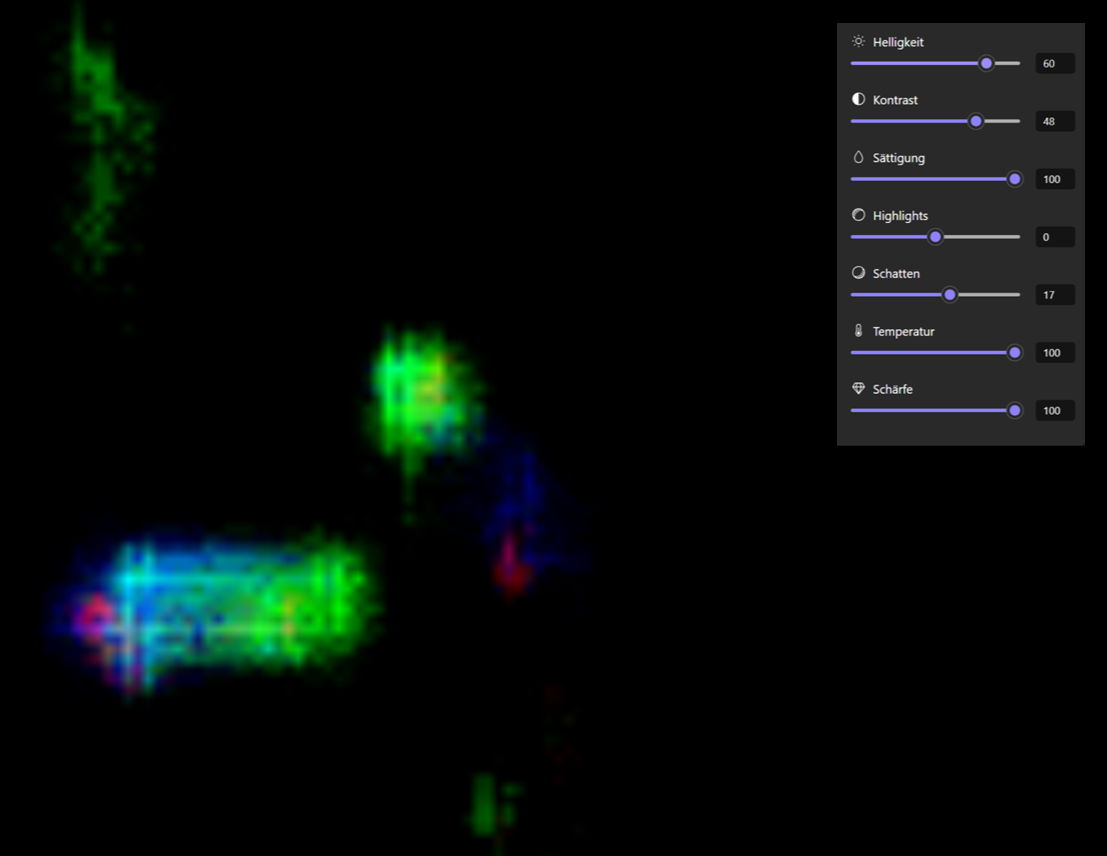
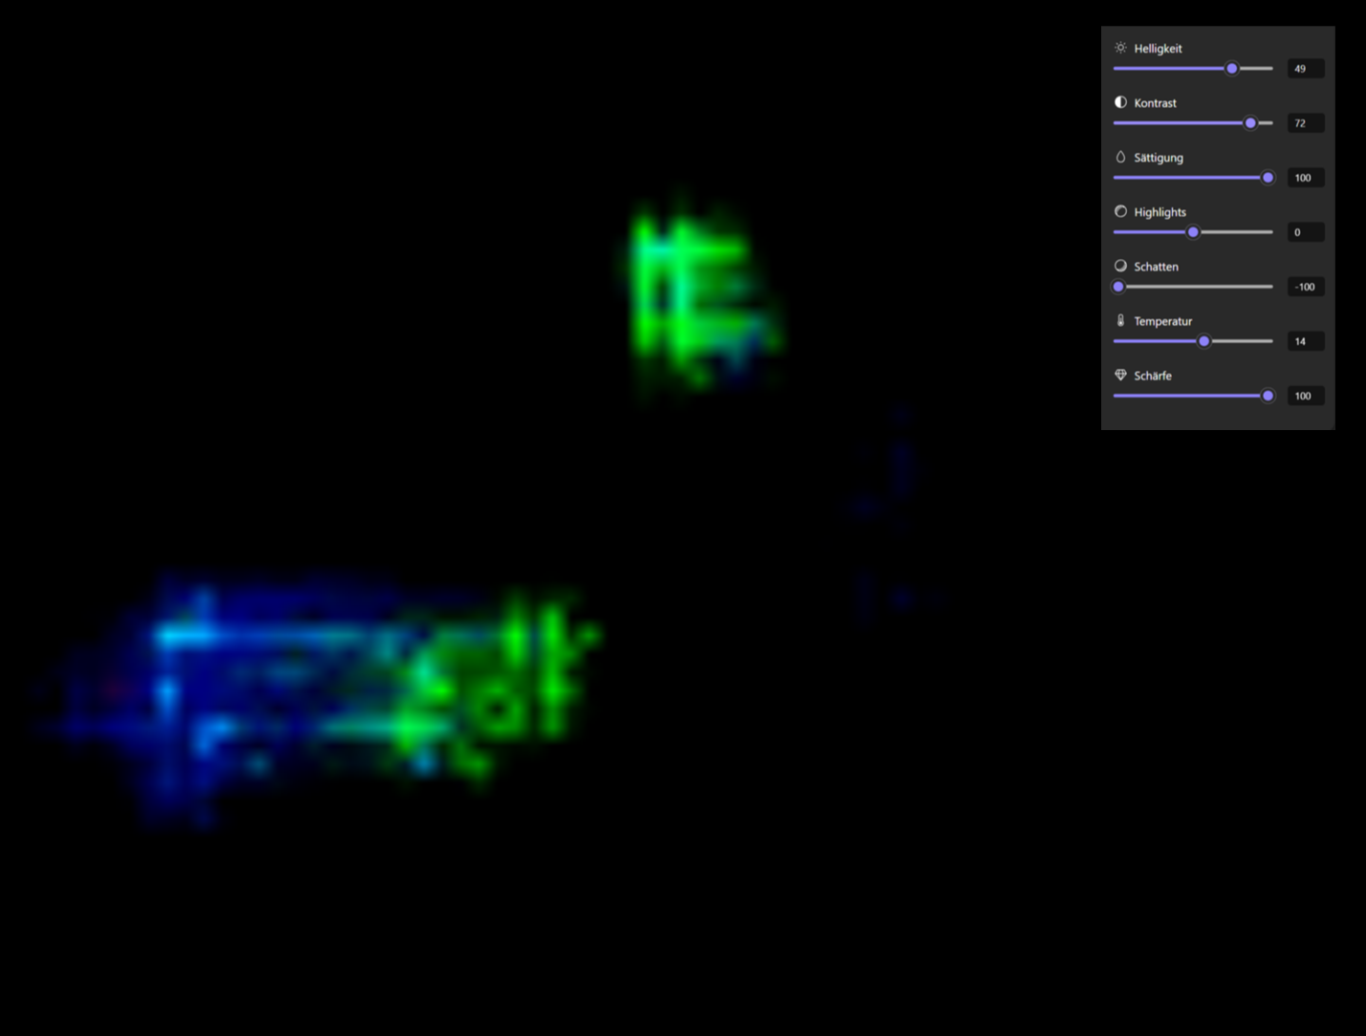
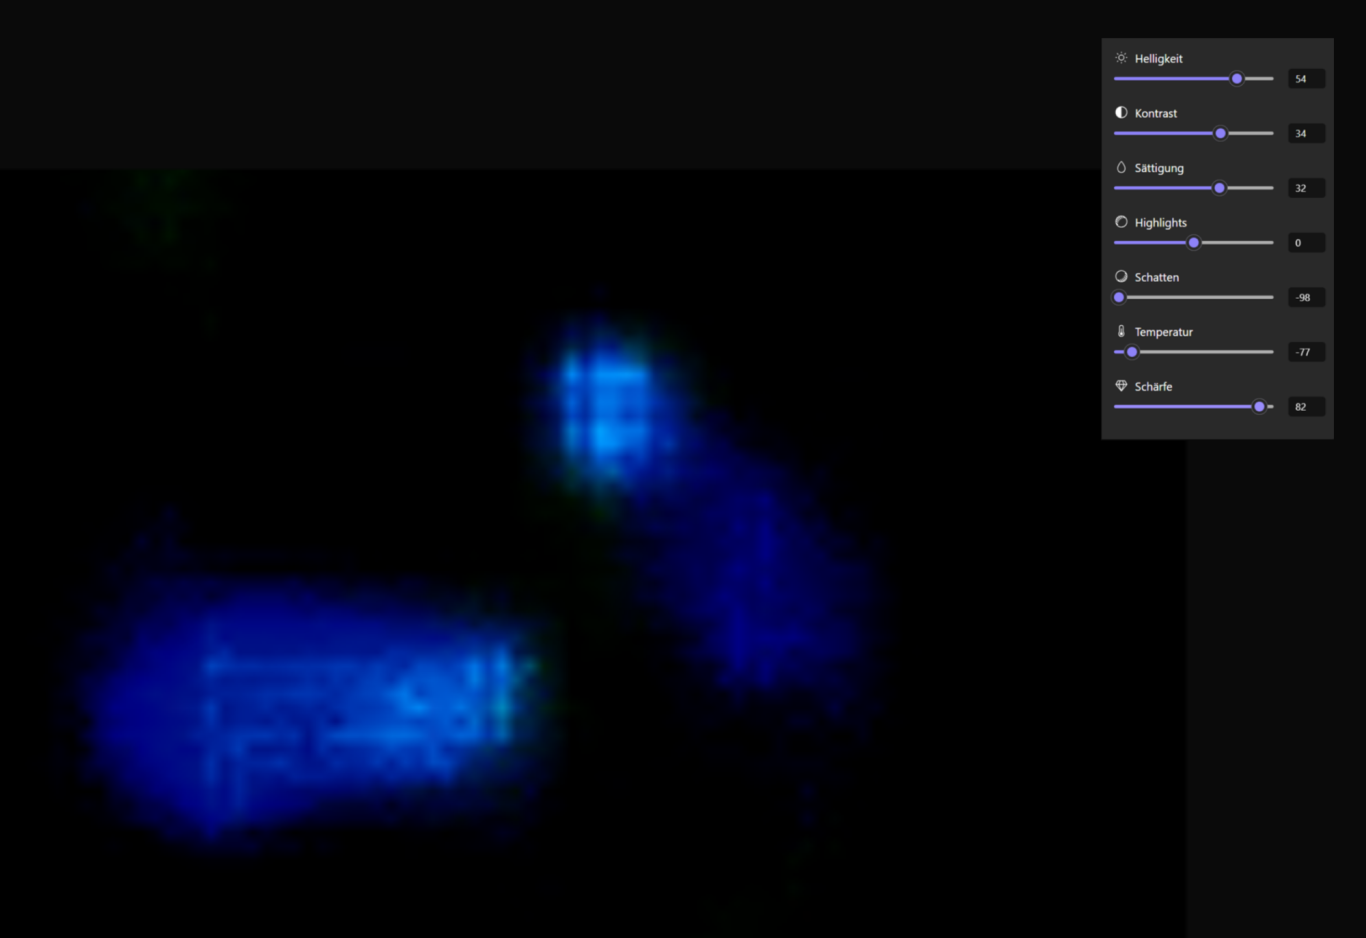
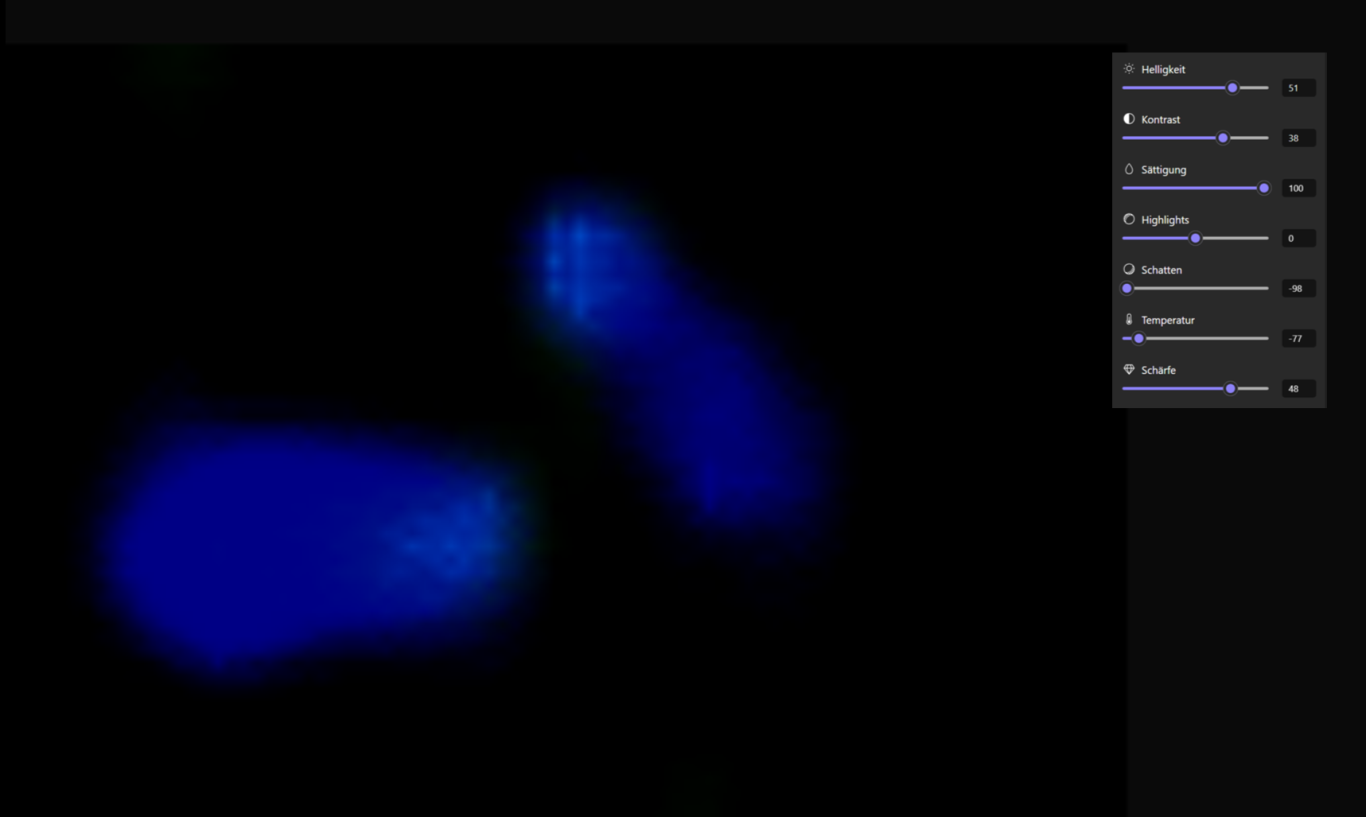
Documented Example of the Reproduction of Figure 9.1.1 (and Figure 9.2.1): This image was created by iteratively combining various configuration parameters using the image editing tool Microsoft Designer. Because the tool is based on a proprietary algorithm, the exact calculation methodology of the individual parameters is not explicitly traceable. Nevertheless, this process made it possible to visualize the pupils and limbi, which were previously hidden beneath the active luminescence. This video documents this reproduction and magnification process.
Gallery 2: Ocular Morphology (Series B)
The following Gallery 2, containing Figures 9.1.1–9.1.14, Series B, presents a further magnification cropped to the configured ROI (see Fig. 2.6), with the configurations corresponding to those in Gallery 1 (Figs. 9.1.1–9.1.14, Series A). Although the identification of a pupil and limbal ring in the left eye was initially unclear, further magnification of the ROI indicates this morphology. Furthermore, the ocular margins of the left and right eyes are clearly distinguishable from the dark surroundings (dark skin color). The resulting transition is identified as the upper and lower eyelid margins.
A lateral reflection is consistently present in the right eye region in the configurations presented here as well. In some of the samples, a parallel line is identified above the right upper eyelid margin, suggesting an eyelid crease. Another curved line indicates a supraorbital margin. Furthermore, it is assumed that the pupils exhibit positional constancy and geometric coupling in the recorded two-dimensional image space.
Click for full size
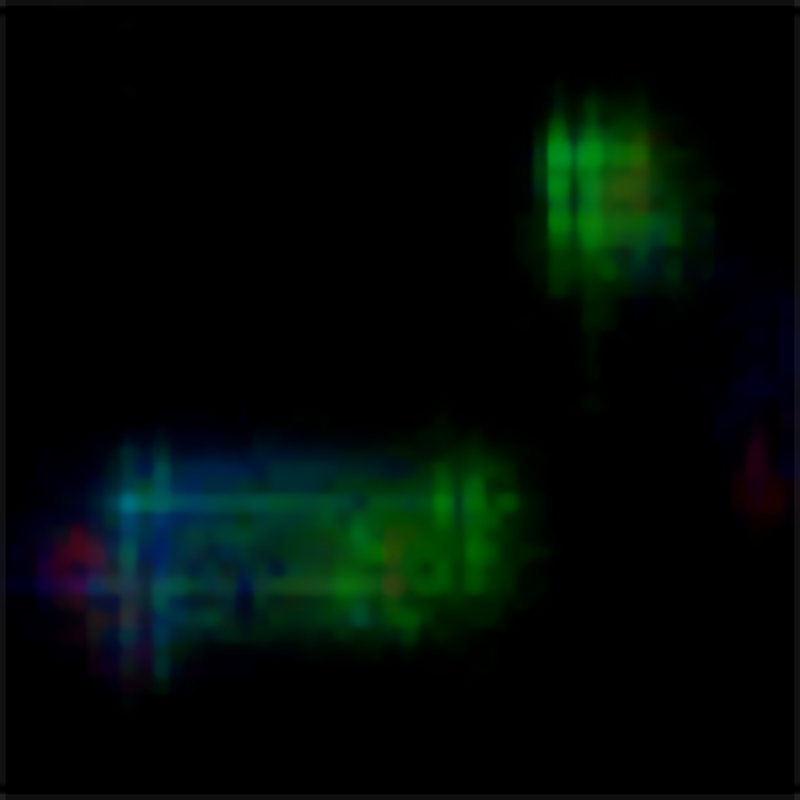
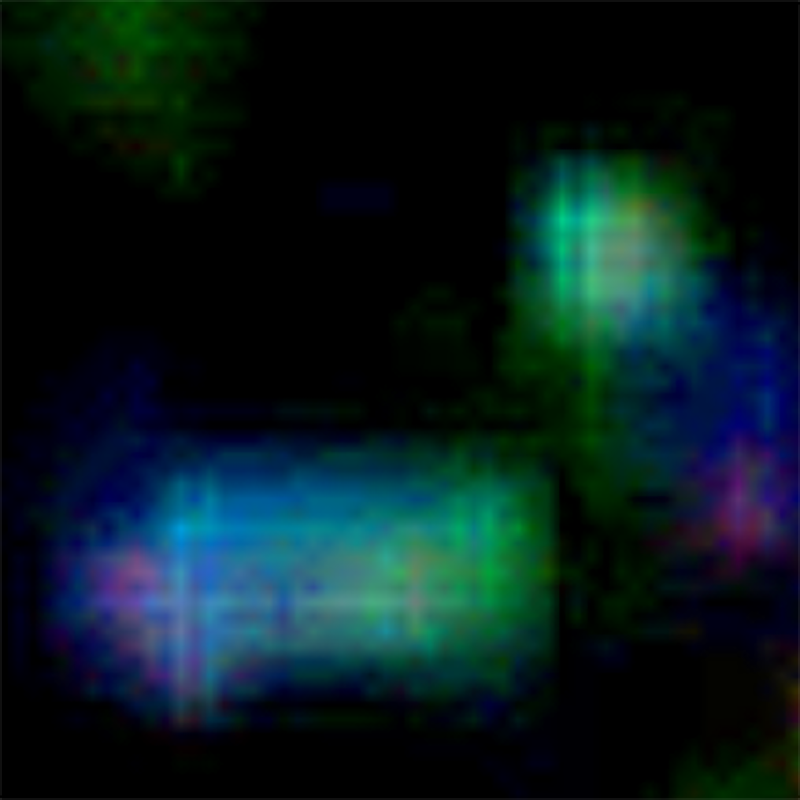
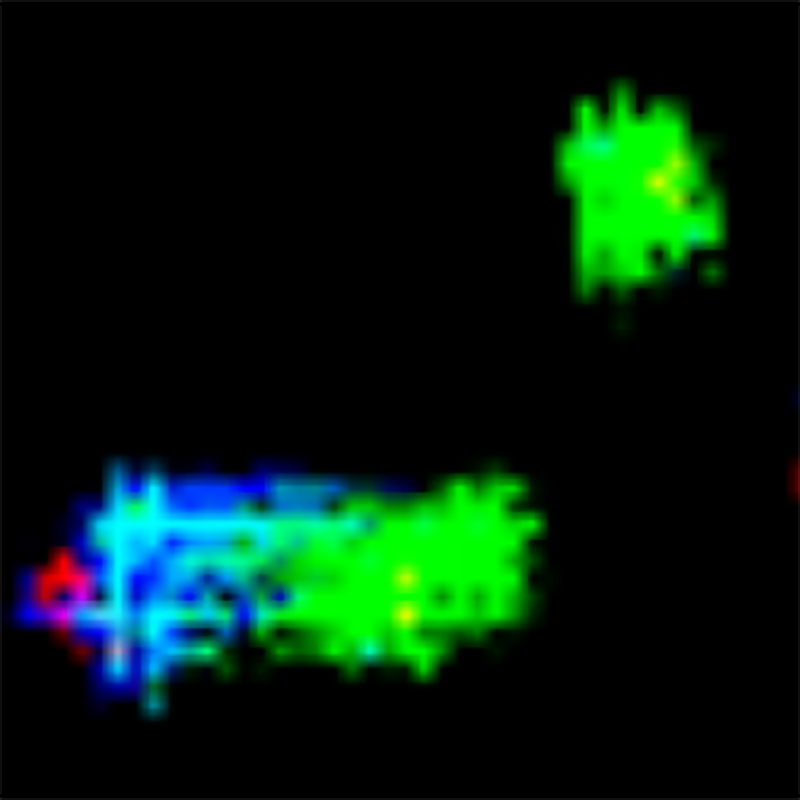
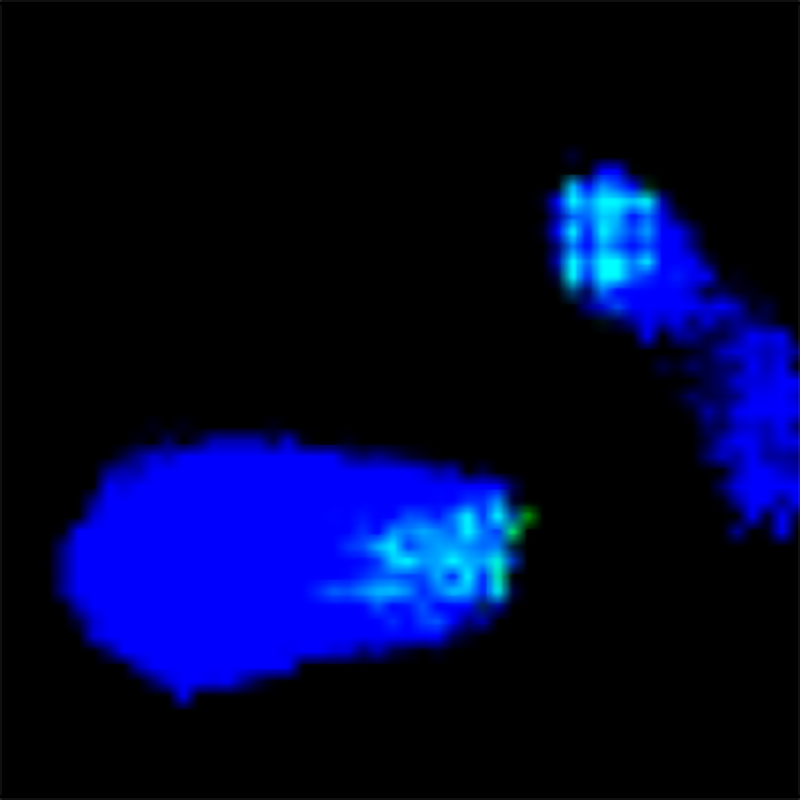
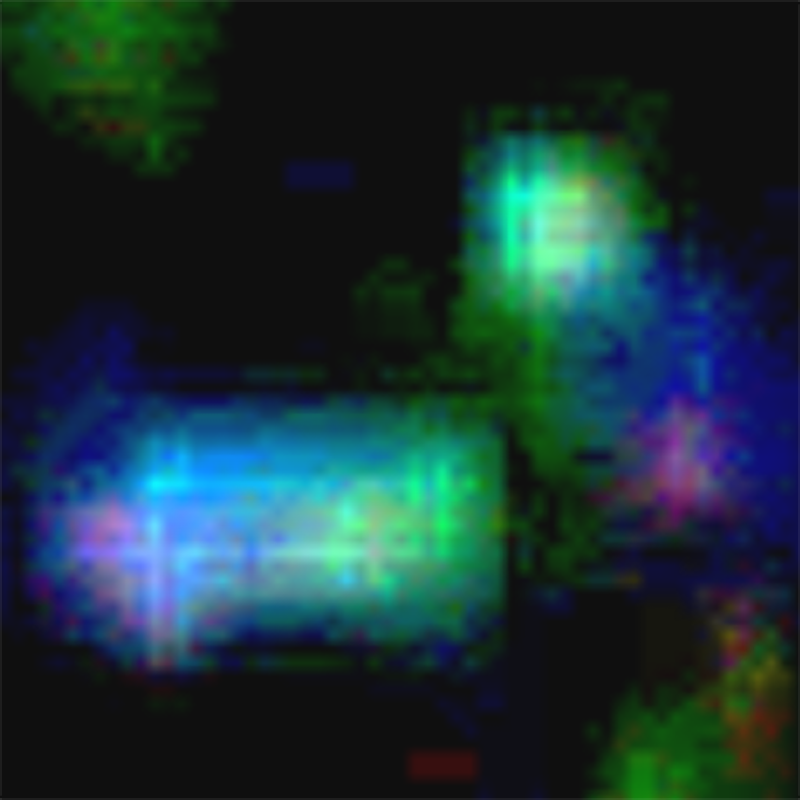
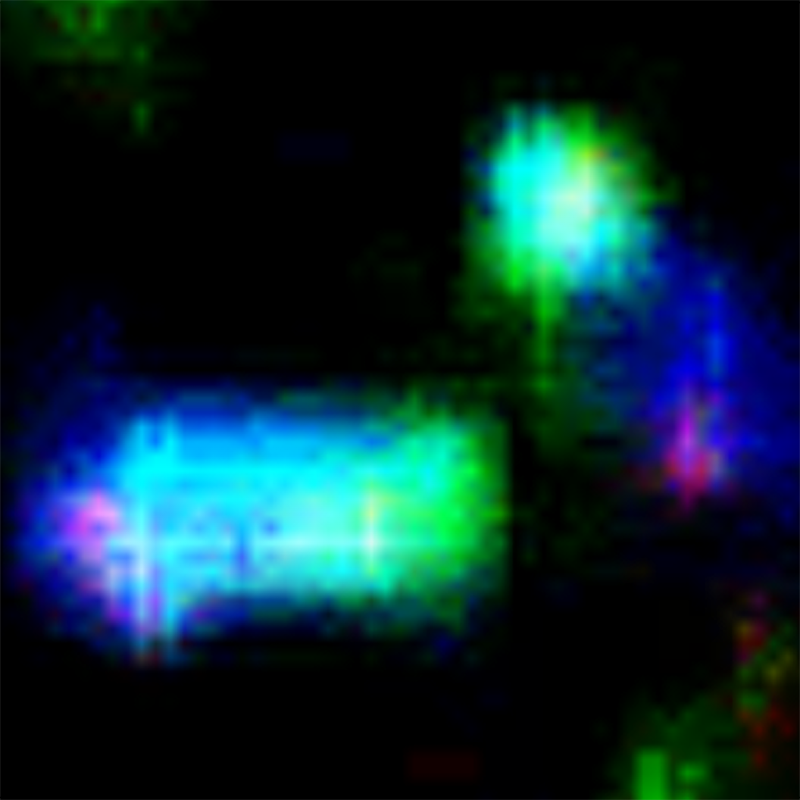
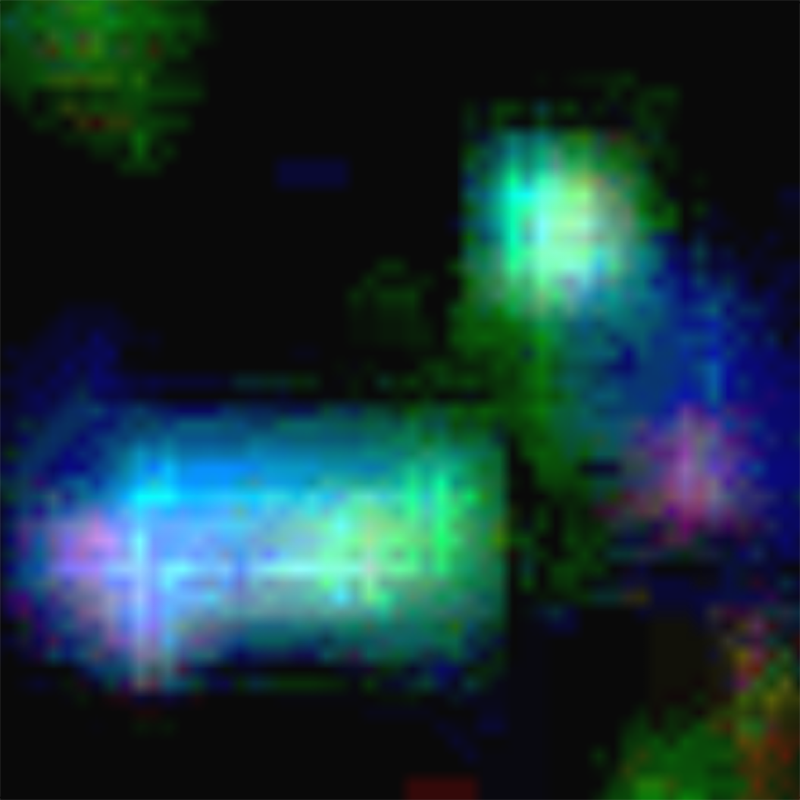
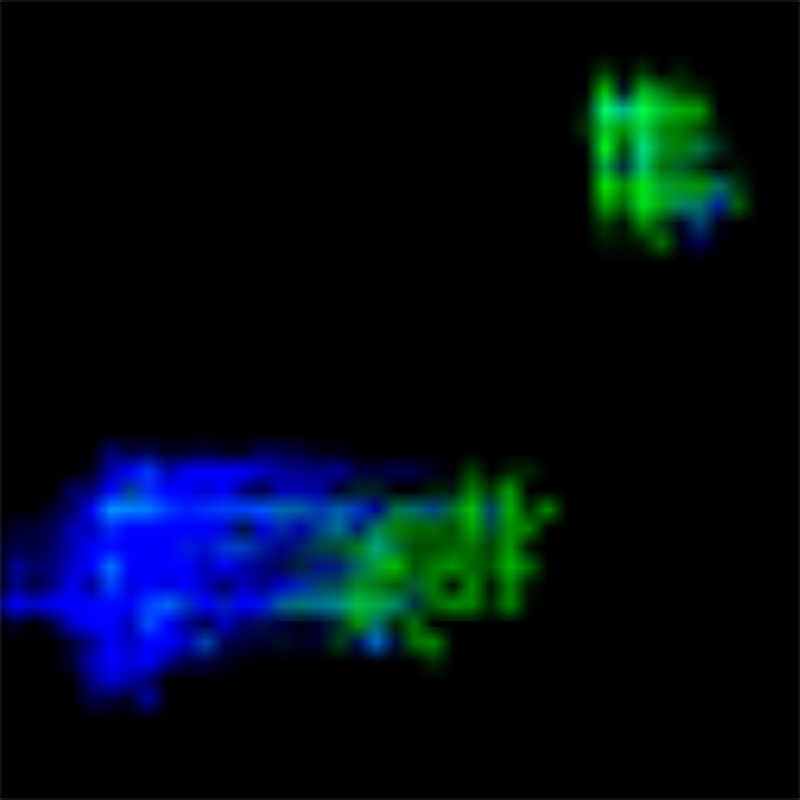
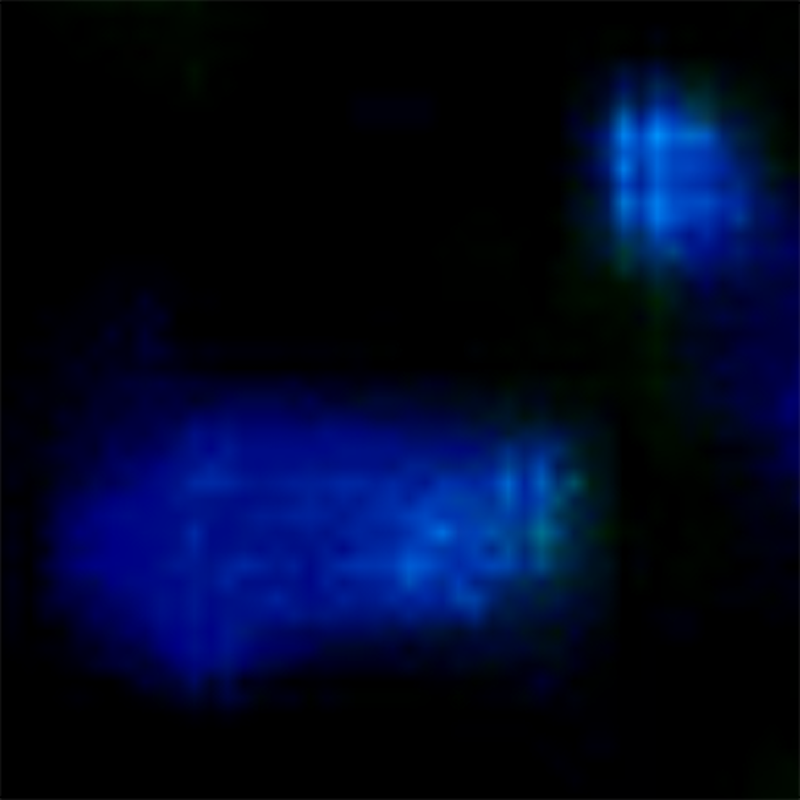
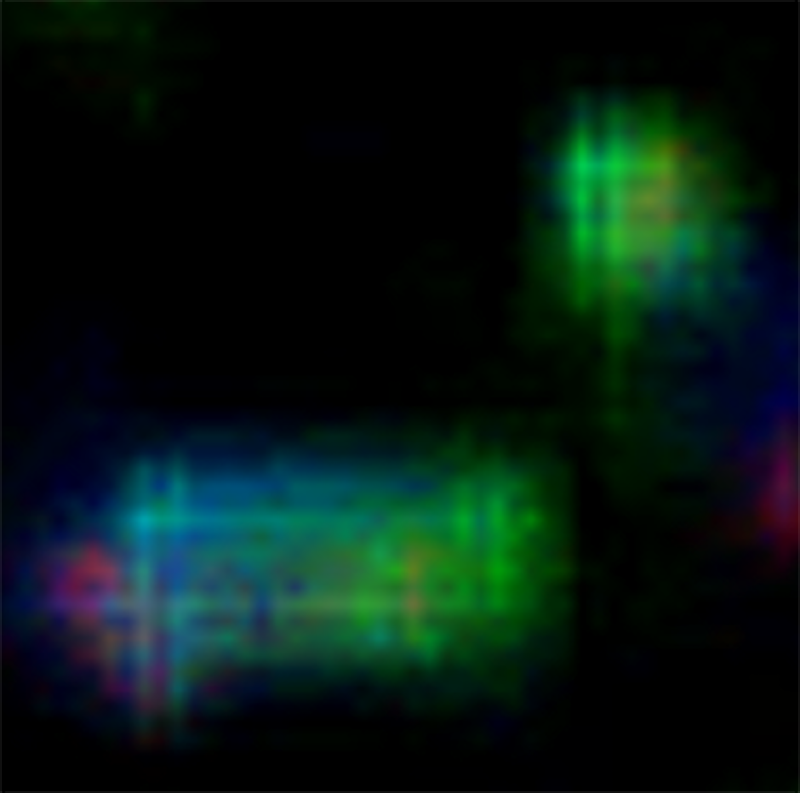
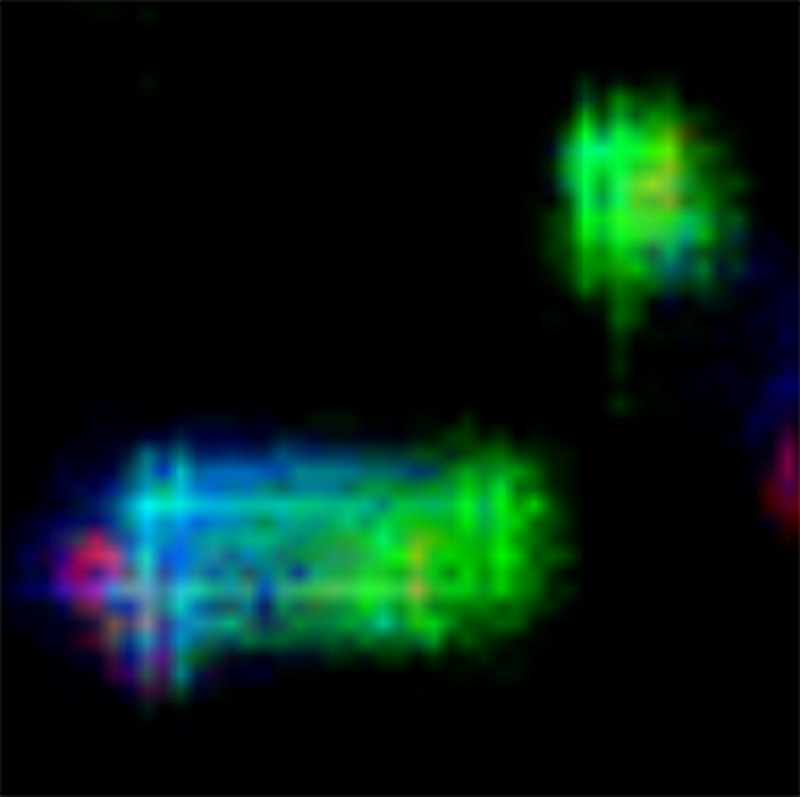
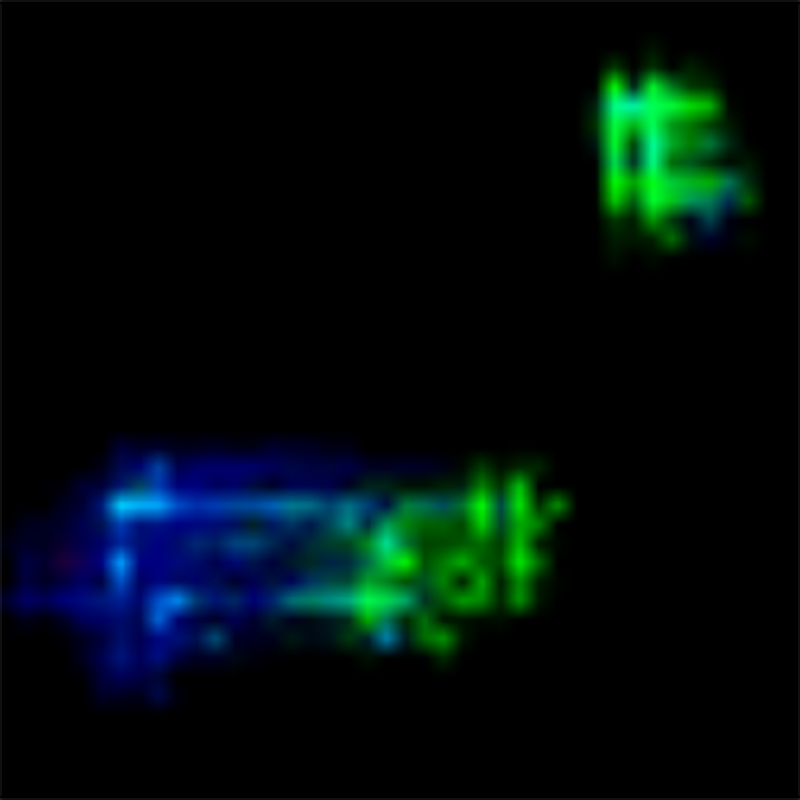
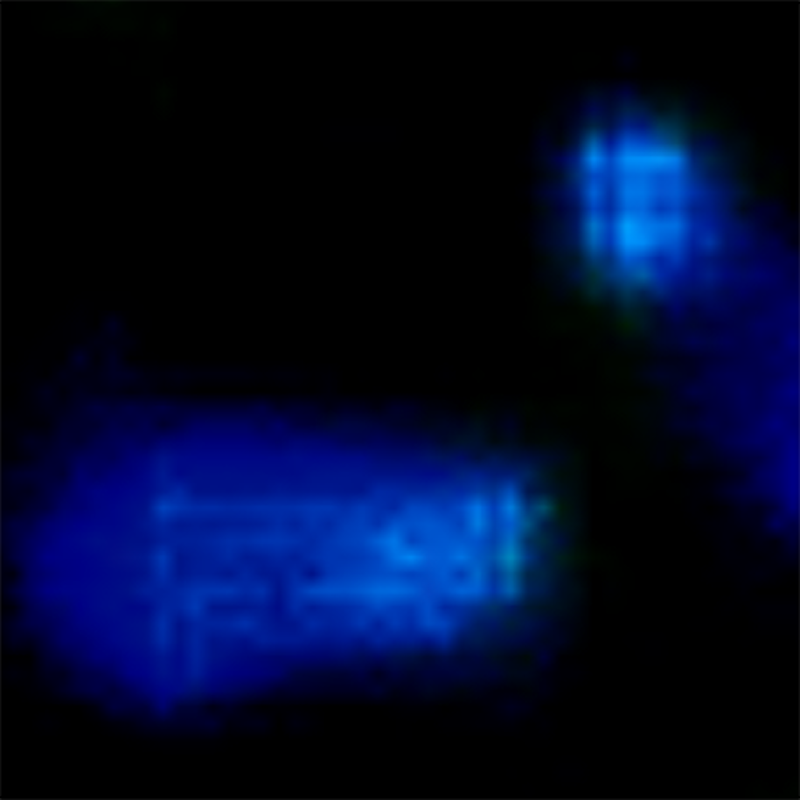
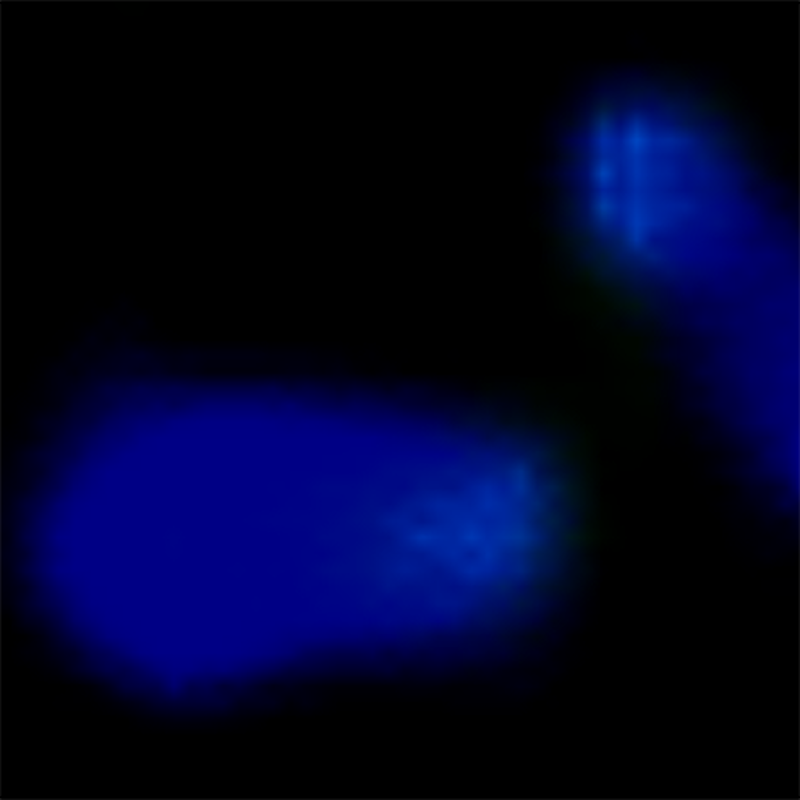
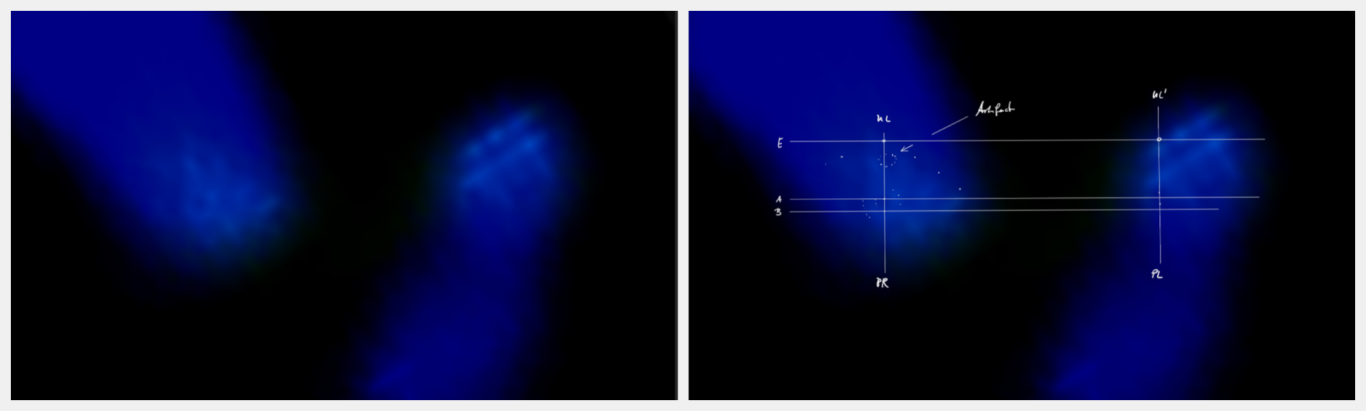
Visual Evidence of Positional Constancy: Geometrically Coupled Pupil Analogs as the Basis for the Coordinate System of the Main Analysis (Samples with Figures 9.2.1–9.2.14, Horizontal Alignment)
The following Gallery 3, "Positional Constancy and Geometric Coupling," comprises Figures 9.2.1 through 9.2.14 and serves as the foundation for the subsequent main quantitative analysis (see reference at the top of the page). These figures correspond to the preceding Figures 9.1.1–9.1.14 (Series A and B). To improve visual perception, the images have been aligned horizontally and rotated 58° clockwise. Each figure (a composite image) consists of two identical images: the left image remains unlabeled, while the right image displays the coordinate system (template) exactly as developed for use in the main analysis. Reference points were determined using horizontal and vertical guide lines positioned at 90° and 180° relative to one another.
- Key Findings: Based on the positional constancy of the pupils and the visually identified most upper points of the open upper eyelid (manually determined vertex), a coordinate system was established for all 14 figures. Subsequent metric analysis confirmed a positional constancy of the pupil centers of SD: 0.01 pixels. This validation points to an unexpected anomaly, given that the images originate from a dynamic image space.
- Methodological Constraints: The coordinate system (vertical and horizontal lines with reference points) drawn in these figures for visualization purposes was manually created and does not serve as the direct basis for the template used in the main metric analysis. Furthermore, the measuring points for the pupil positions in this displayed coordinate system were defined differently than in the study template (the measurement was taken at the lowest and uppermost point of the respective pupil analog).
- Further Observations: In addition to the identified pupils and limbi, other apparent pupils (diffusely distributed) are visible throughout the ROI; these are classified as motion artifacts. A structure above the right eye (on the left side of the image, partially marked with a turquoise line) indicates a bony prominence. Furthermore, some configurations provided indications of a nasal structure. An element interacting with the face—identified in subsequent sections as a tank—was designated as an "object."
Notes on Terminology and Figure Labels
- The designation "Iris" in some of the labeled images was not replaced by the updated terminology "limbus/limbal ring (shadow)" used in the main analysis. Readers are requested to take this discrepancy into account.
- The labels for the figures (Fig. 9.2.1–9.2.14) were adopted because they were used directly for the underlying main analysis.
The following Gallery 3 "Positional Constancy and Geometric Coupling" contains the Figures 9.2.1 - 9.2.14:
Figure 9.2.1
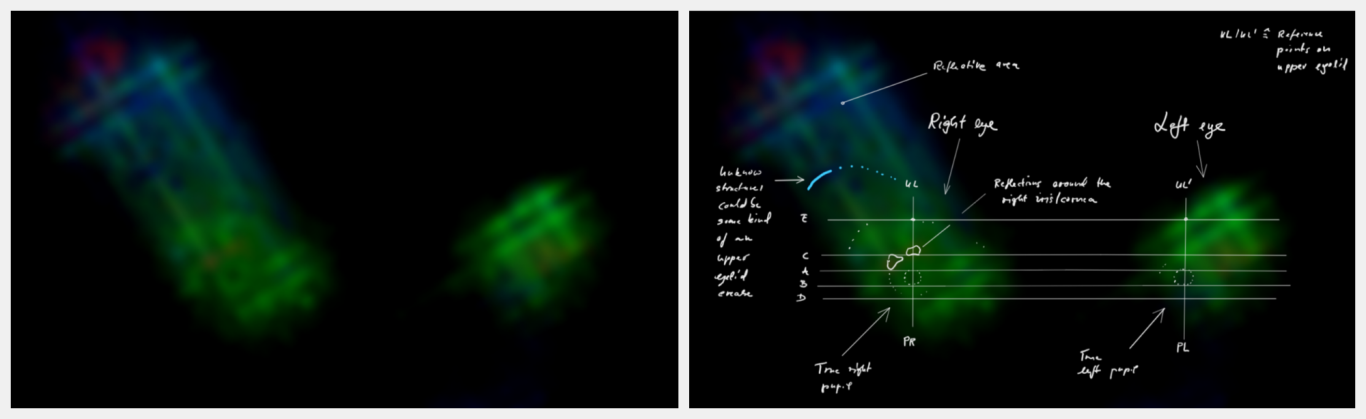
Figure 9.2.2
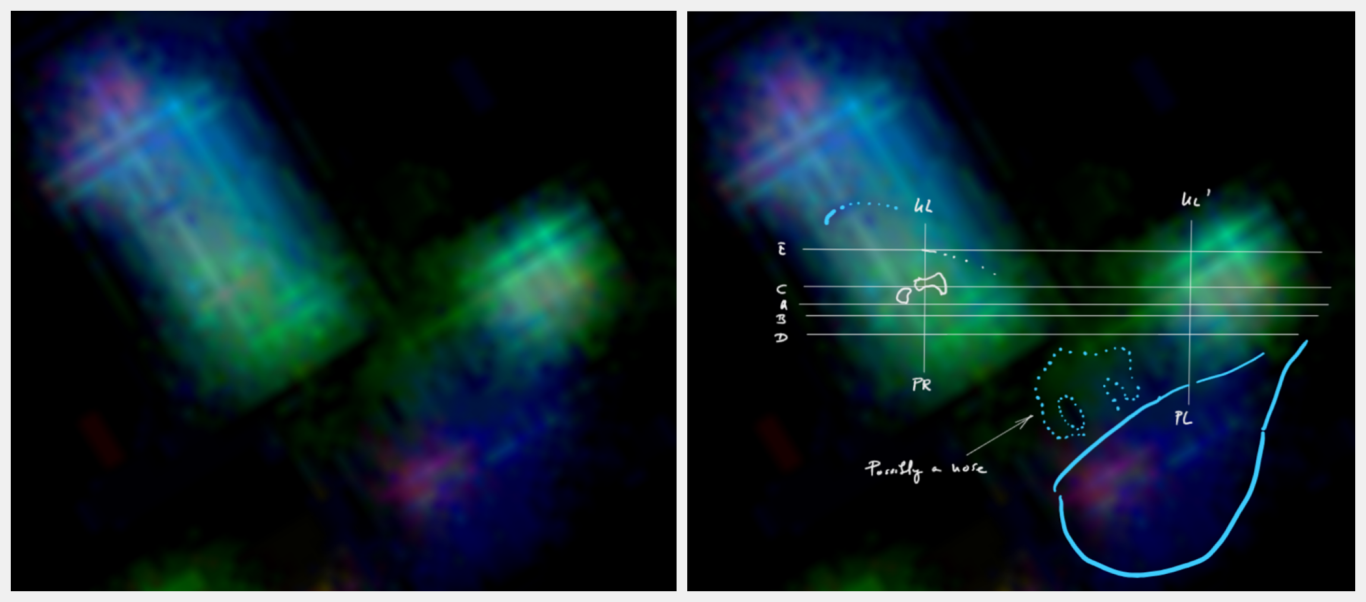
Figure 9.2.3
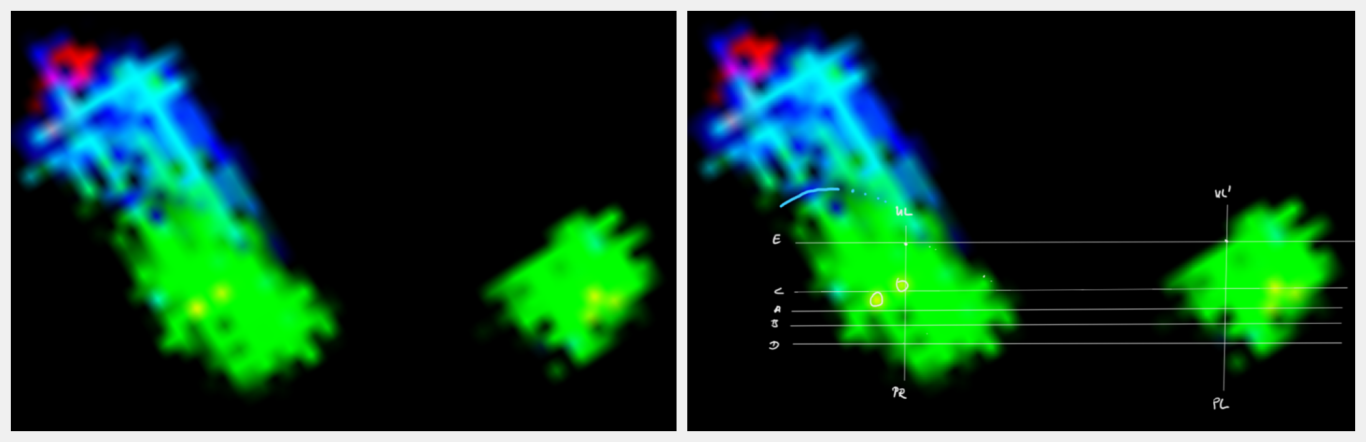
Figure 9.2.4
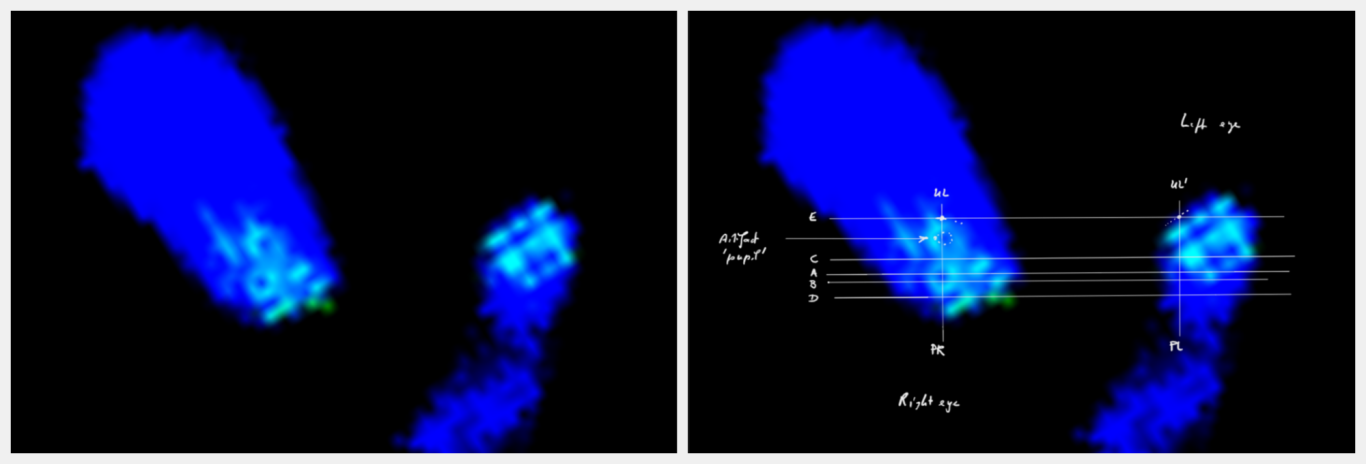
Figure 9.2.5
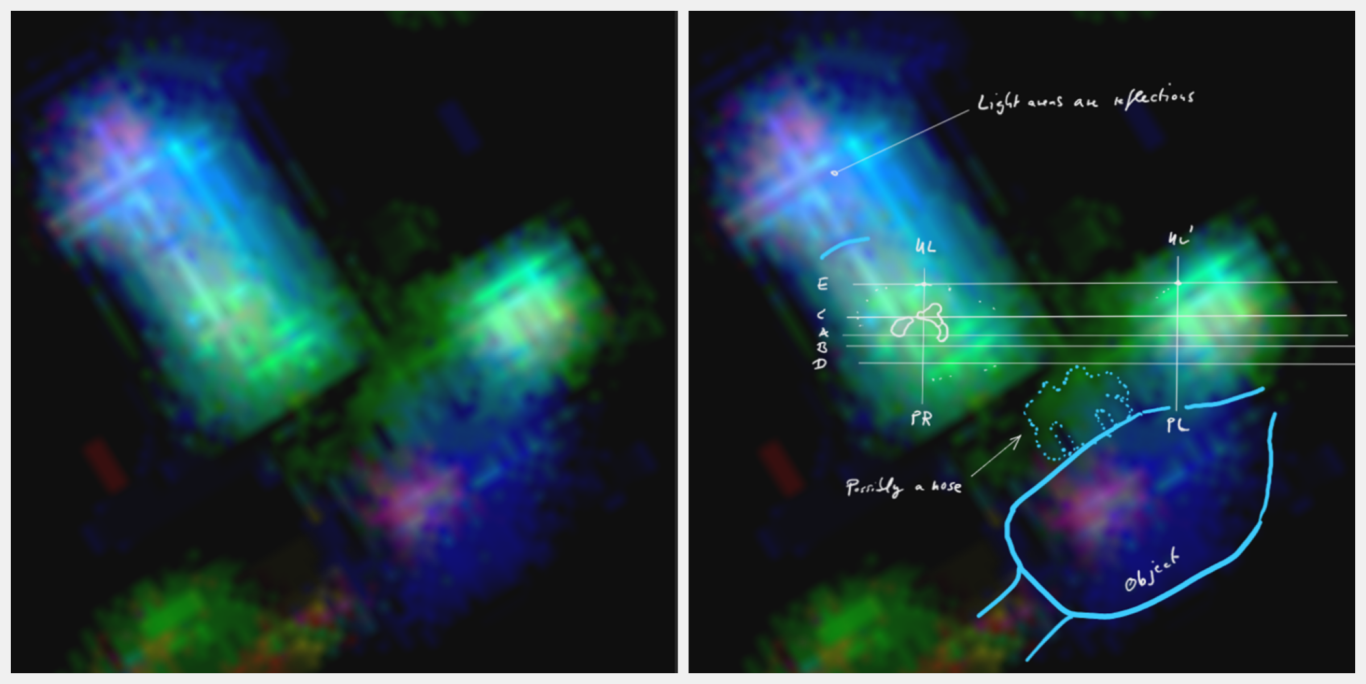
Figure 9.2.6
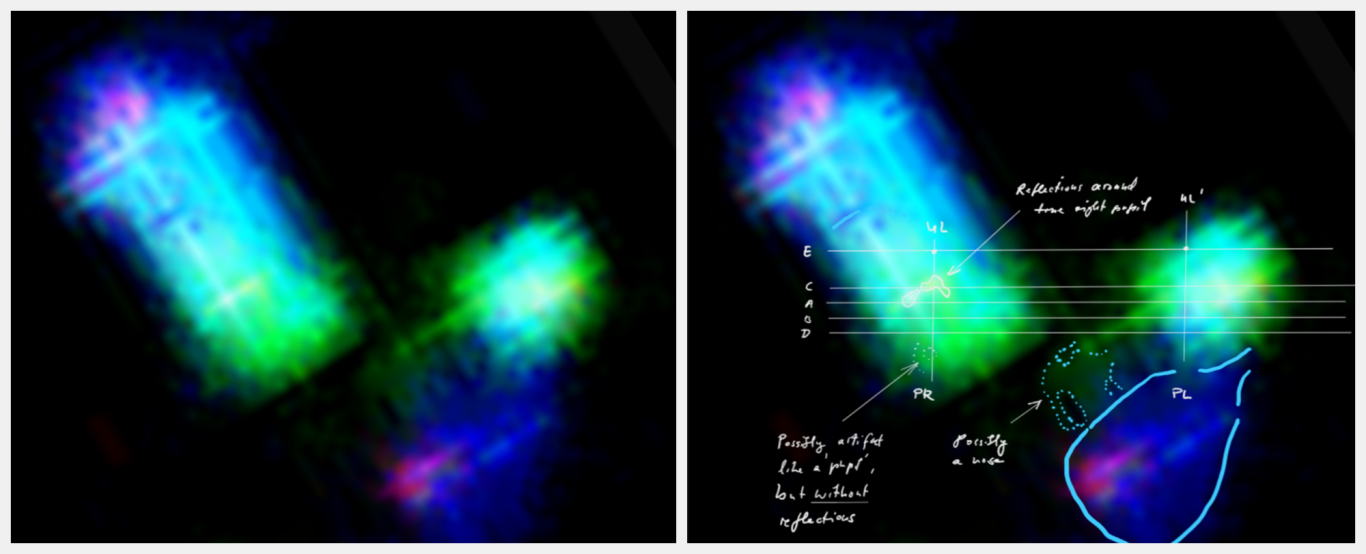
Figure 9.2.7
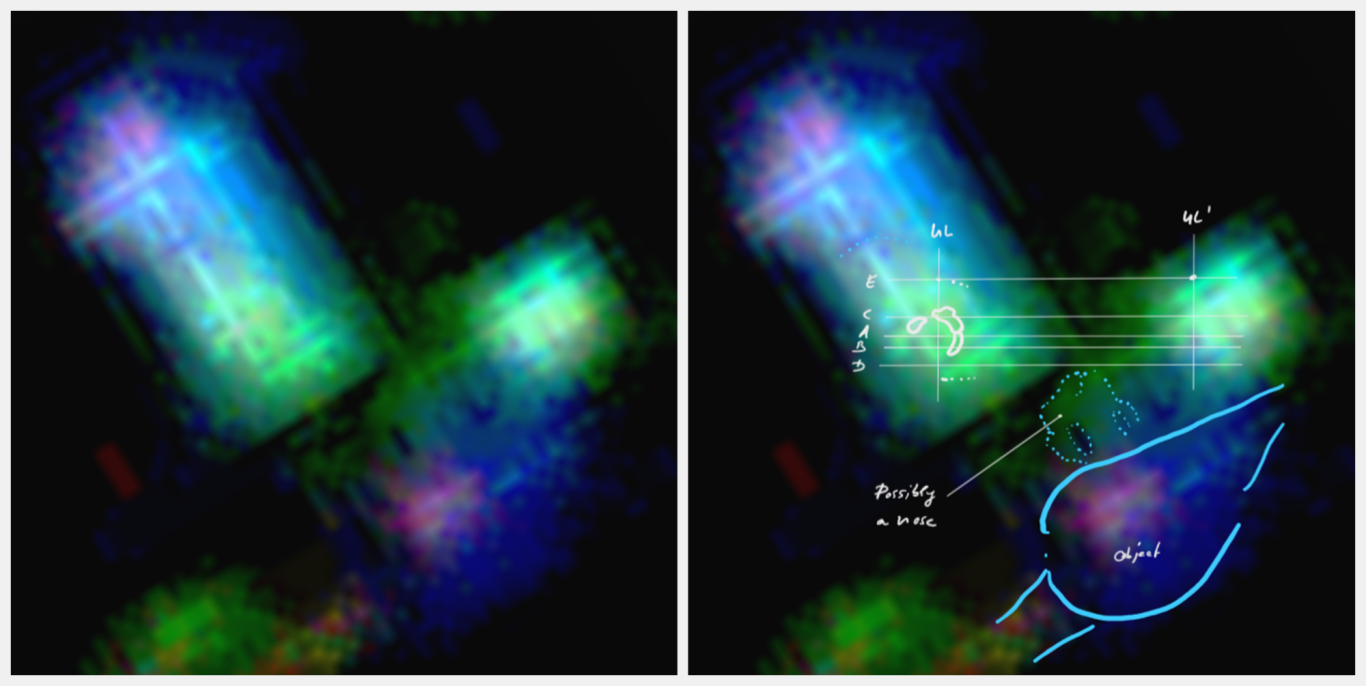
Figure 9.2.8
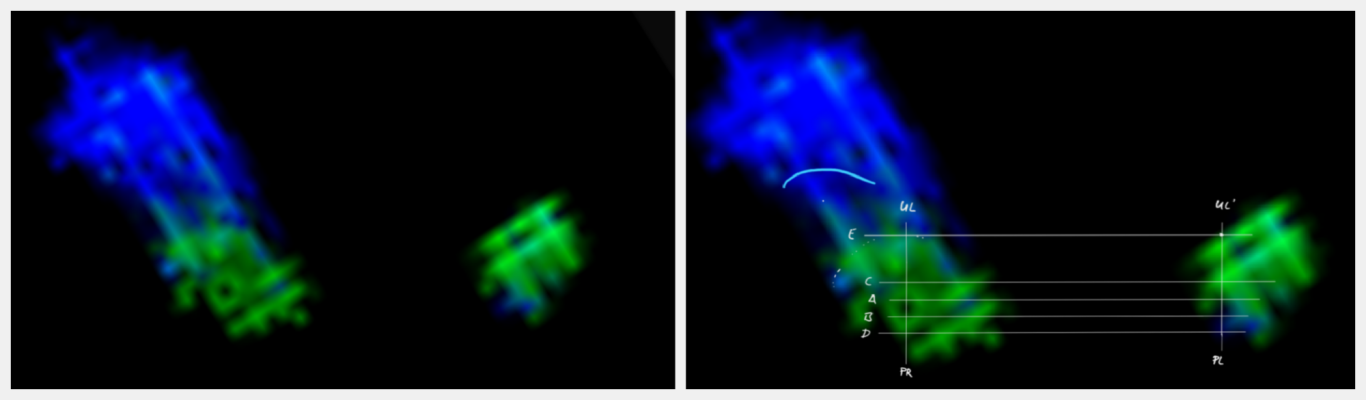
Figure 9.2.9
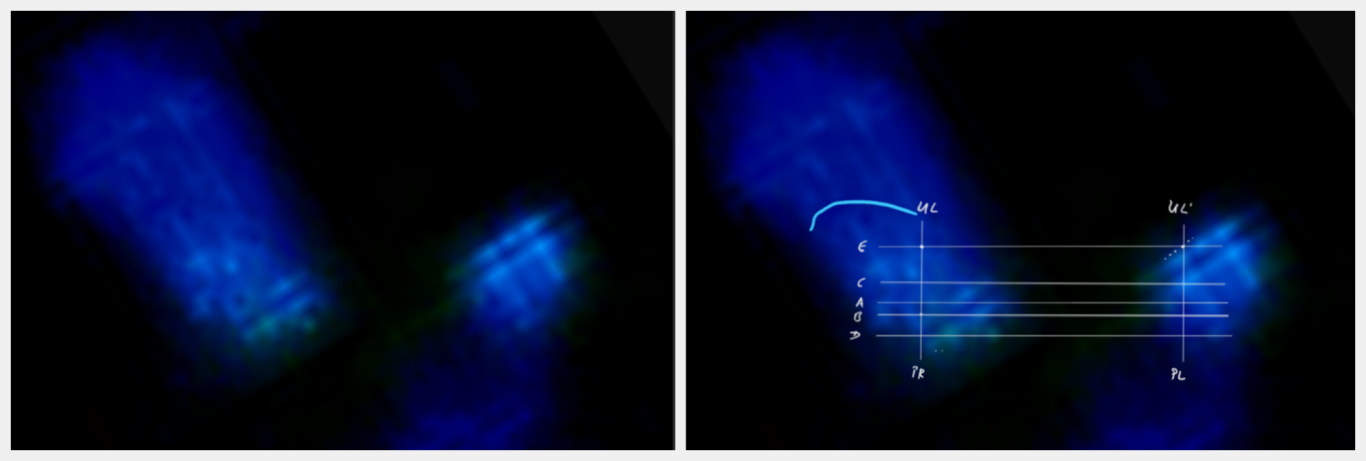
Figure 9.2.10
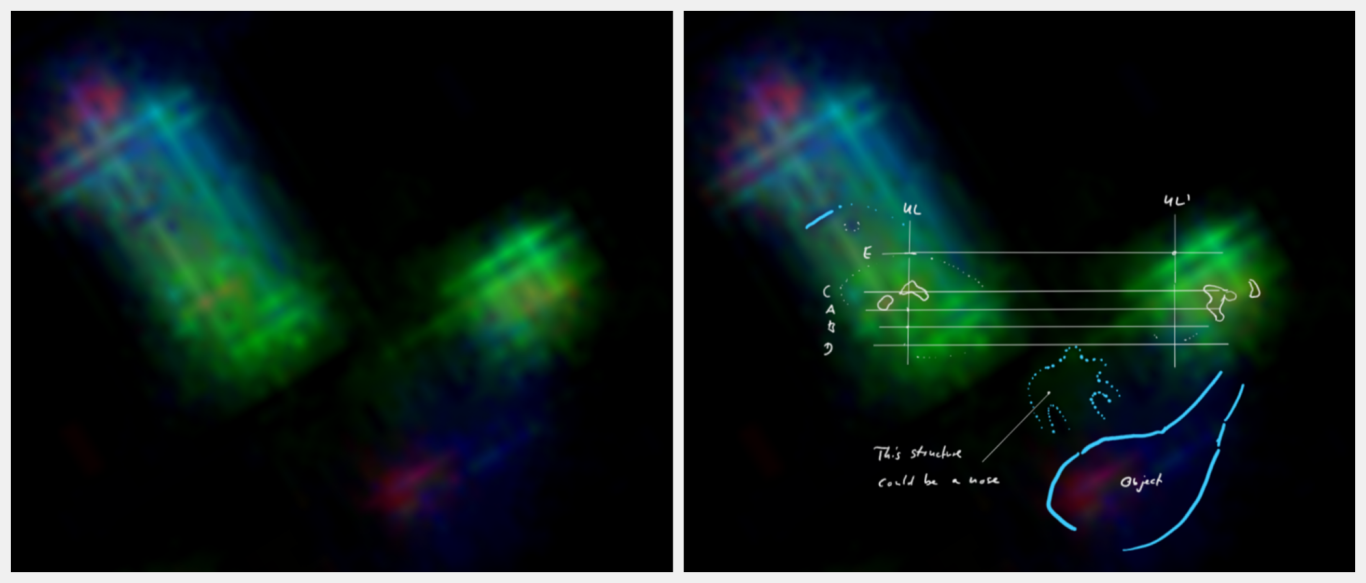
Figure 9.2.11
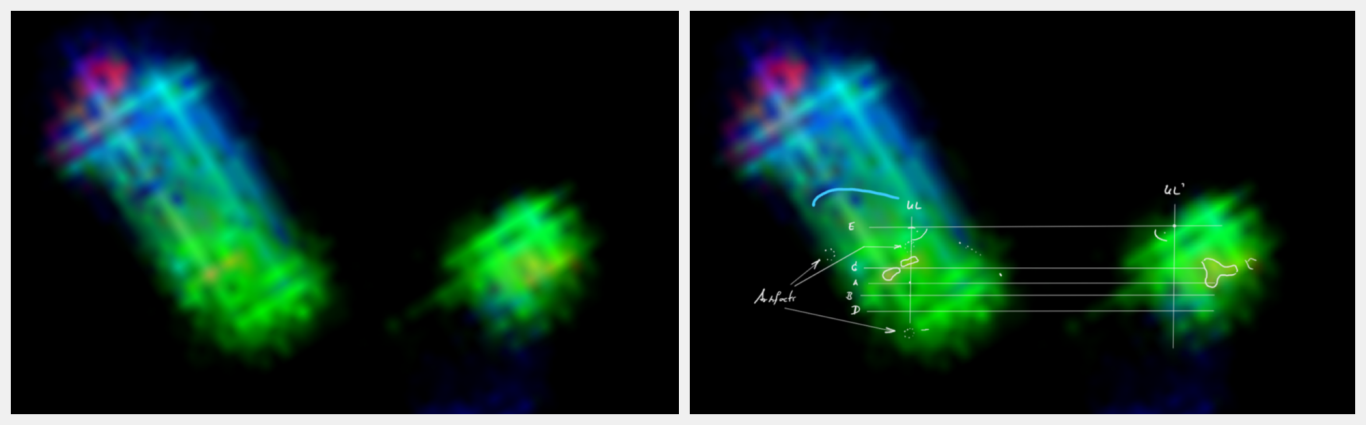
Figure 9.2.12
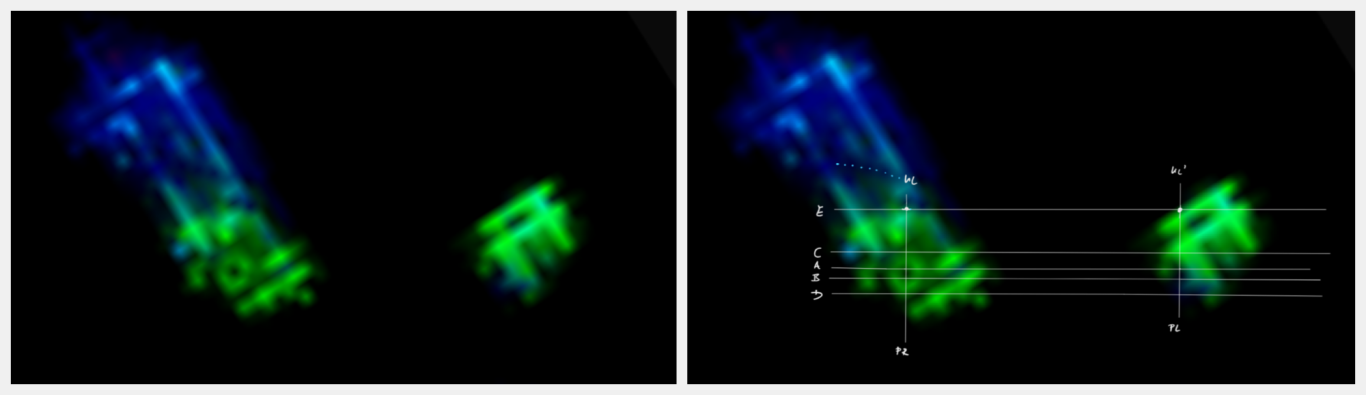
Figure 9.2.13
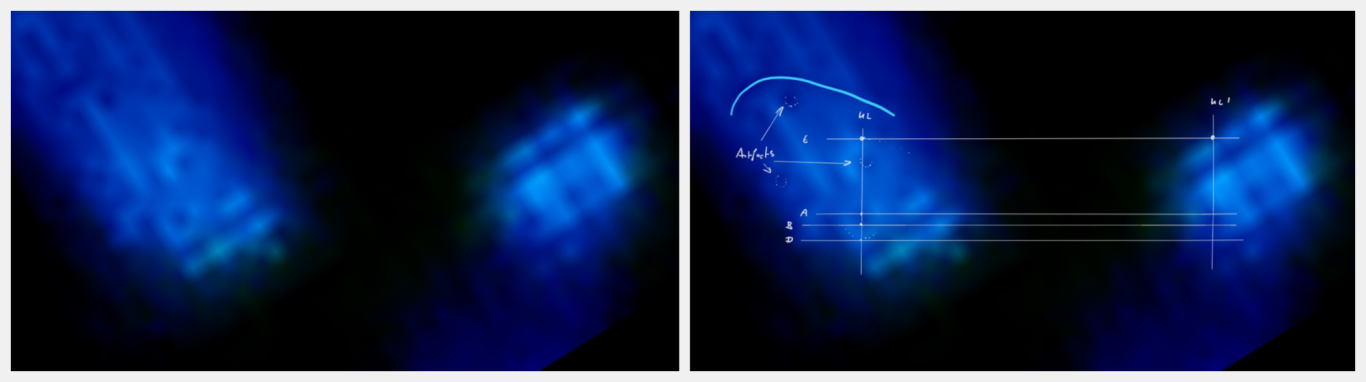
Figure 9.2.14
3.2 The Head — Position, Morphology and Light Reflections
This section is dedicated to the visual analysis of the structures on the upper and lateral parts of the identified entity's head. The investigation proved particularly challenging due to the extremely low visual contrast against the surrounding dark background. Only through the targeted application and variation of configurations did subtle areas of light and textural differences—previously hidden in the source image 7—become visible. The configuration parameters applied in the respective images now make it possible to draw specific conclusions regarding positioning, "skin color," and head shape based on reflection patterns, despite the slight differences in brightness.
Figure 3.7: Hypothetical Head Positioning and Reflection Patterns
This figure illustrates the hypothesized head position, highlighted by a marked longitudinal axis (right image). The left image provides an unobstructed, unmarked view.
- Observations: The entity's head is turned away from the bright UAP foreground toward the left (to the right in the image) and is also tilted upwards. This detail regarding head position was already evident in Subsection 3.1 through reflective areas. The visible areas of light on the head indicate reflections caused by the bright UAP foreground.
- Reproducibility: Due to a parallax error (the viewer looks at the entity from the right), only an approximate head posture can be described. Due to the low contrast between the head and the dark background, a precise delineation is not possible using the MD tool employed. However, it should be noted that a clear delineation of the head outline within the image space is possible and reproducible using a professional editing tool.
Configuration Parameters: Brightness: 89%, Contrast: 68%, Sharpness: -31%.
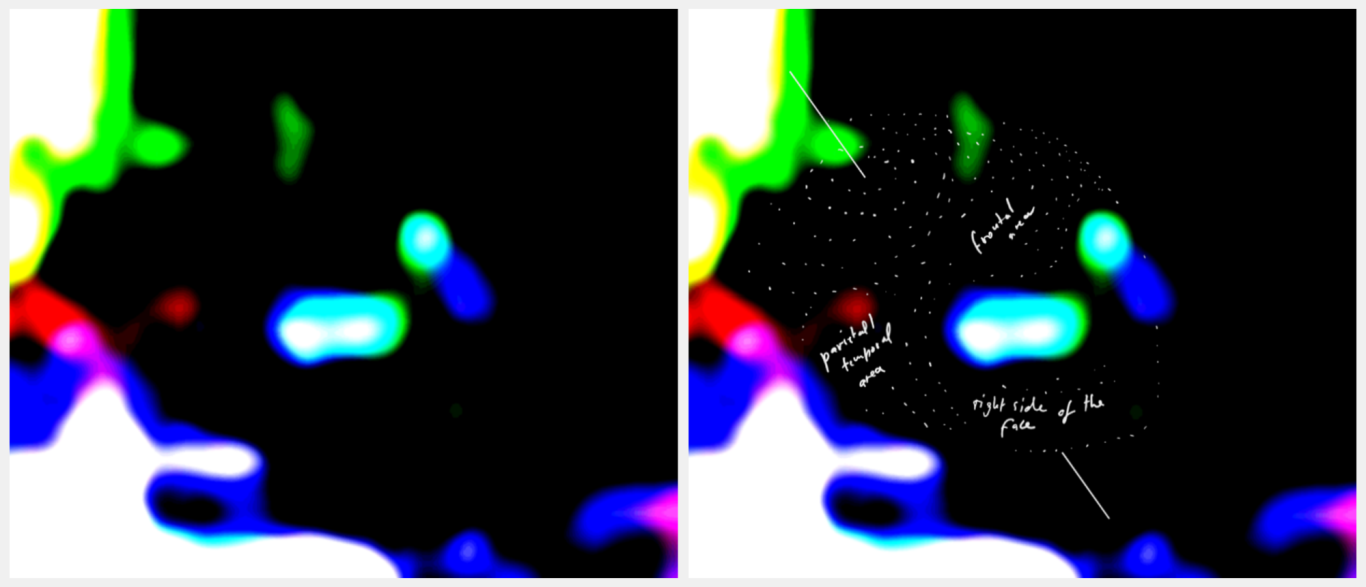
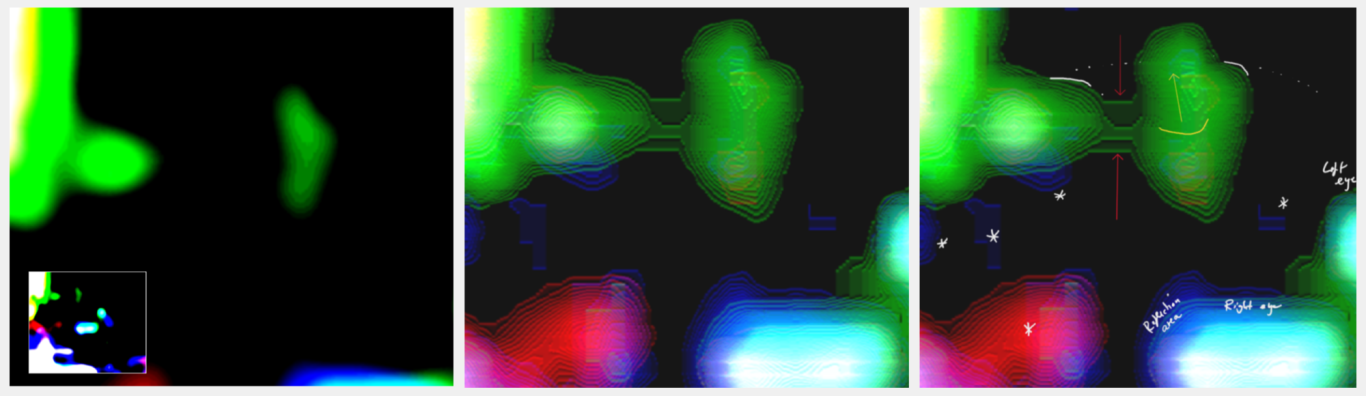
Figure 3.8: Reflections Localized on the Head Surface and UAP Downward Movement
The figure consists of three views: The image on the left is an enlargement of Fig. 3.7 (inset), focusing on the visible light areas that appear green. The middle and right images show the same area. The settings here were chosen specifically (including by increasing sharpness) to allow structural inferences to be drawn based on artifact structures.
- Localization of Reflections: The configurations of the center and right images were chosen to explicitly induce the formation of artifact rings. This examination clarifies the localization of reflections situated in the upper part of the image. The green artifact rings—or reflection structures—illustrate their position on a surface, specifically the surface of the head. They are caused by light from the bright UAP foreground (moonlight).
- Inferring Head Shape from Reflections: The white lines drawn along the outer artifact ring of the two greenish reflections lie close to the head's boundary (see right image). This premise was verified using the "Invert" filter in Adobe Photoshop. As this analysis utilizes the Microsoft Designer tool, the result is not displayed here. A precise determination of the head's boundary is not possible with the MD tool used, as the skin tone differs only slightly from the dark background. The green area of uniform color between the two reflections (see red arrows, center and right images) visualizes a merging of the light. This finding confirms that the green reflection areas are located on the surface of the head. Based on this finding, the head surface is assumed to be smooth and hairless. The dotted white line indicates the hypothetical head boundary—or shape—derived from these findings, ending near the left eye.
- Implications Regarding a Downward Movement of the UAP: An observation concerning the right-hand green reflection: This was analyzed using a drawn yellow line that divides the area. The lower section represents the reflection located on the (horizontal) surface of the head. The upper, vertical section suggests a downward movement. The relationship of the vertical component to the reflection surface is unambiguous: the artifact rings demonstrate a clear connection between the planar and vertical components, which are also identical in color.
- Additional Reflections: Further reflections are visible on the surface of the head (marked with asterisks), including a larger reflection that appears red. Here, too, the artifact rings confirm that this reflection is localized on the surface of the head (right parietal/temporal region).
Configuration Parameters: Left Image: Brightness: 89%, Contrast: 68%, Sharpness: - 31%. Middle and right Image: Brightness: 92%, Contrast: - 35%, Shadows: 100%, Sharpness: 100%.
3.3 The Nasal Structure
During the examination of Images 9.2.1 to 9.2.14, structures in the upper central facial region drew attention; initially, they were classified as undifferentiated artifacts. Closer inspection, however, revealed indications of a nasal morphology. To improve visibility, the underlying image series was aligned by rotating it 58° clockwise relative to the horizontal.
The following Figures 3.9 to 3.13 illustrate the nasal structures by tracing the supposed artifact structures in detail. During the elaboration it was found that there is a three-dimensional, self-contained nasal structure on the two-dimensional image area examined. The identified nostrils appear elongated (right > left), which is attributed to internal and external movements. In addition, the lower part of the area examined (nose tip, nasal bridge and nostrils) appears to be in an anatomically incorrect position. The root of the nose itself lies exactly in the middle between the eyes.
The experiment determined that this incorrect positioning is a motion artifact. Given the prioritization of key aspects, a detailed description of the experiment—conducted as follows—is omitted here: First, a vertical centerline is drawn through the lower section, with the line's anchor point positioned at the center of the columella. This lower section is then isolated and rotated clockwise until the drawn centerline lies parallel to an imaginary centerline of the nasal root. In the final step, the centerline of the lower section is aligned with the centerline of the nasal root. The three-dimensional artifact lines in this area, the color-based demarcation separating the area from its surroundings, and the observed rotation/displacement effect all clearly indicate that this is a nasal structure.
Gallery 4: Identification of Nasal Anatomy
Figures 3.9 to 3.13 in the following gallery 4 each consist of three views incorporating additive configuration parameters, with the bottom image showing the overall view (ROI). The upper views present the area under examination; the left image provides an unobstructed view, while the right image displays the detailed rendering (tracing) of artifact lines and additional markers. The configuration parameters used here combine the underlying configurations from the image series 9.2.1 to 9.2.14 (Series A and B) with additive configuration parameters. These supplementary parameters were selected to optimize the rendering, ensuring that the artifact lines stand out clearly for the analysis of the area under examination.
Fig. 3.9: Nasal structure – Tracing and Positional Analysis (corresponds to Fig. 9.2.2)
The marking in the overall view indicates the area under examination. The tracing of the artifact lines in the top-right image reveals an organized, three-dimensional structure based on their orientation. A nasal bridge (see marking in Fig. 3.10) as well as a right and a left nostril (nasal opening) are discernible. Both nostrils appear as elongated, black regions. The right nostril is more elongated than the left. For orientation purposes, a vertical line has been drawn through the center of the eye region; this clearly shows that the root of the nose is already anatomically correctly positioned. A second line has been drawn down the center of the lower section, which encompasses the nostrils, the tip of the nose, and the nasal bridge.
As previously mentioned, the drawn center lines enable the rotation/displacement test to be performed. Despite the inherent parallax error (the viewer is looking at the right half of the face), the rotation and displacement of the lower section's midline demonstrate that the visible position of the nasal structure has shifted away from its normally correct location (centered on the vertical line) due to movement (motion blur).
Additional Configuration Parameters for Fig. 9.2.2: Brightness: +50%, Sharpness: +100%.
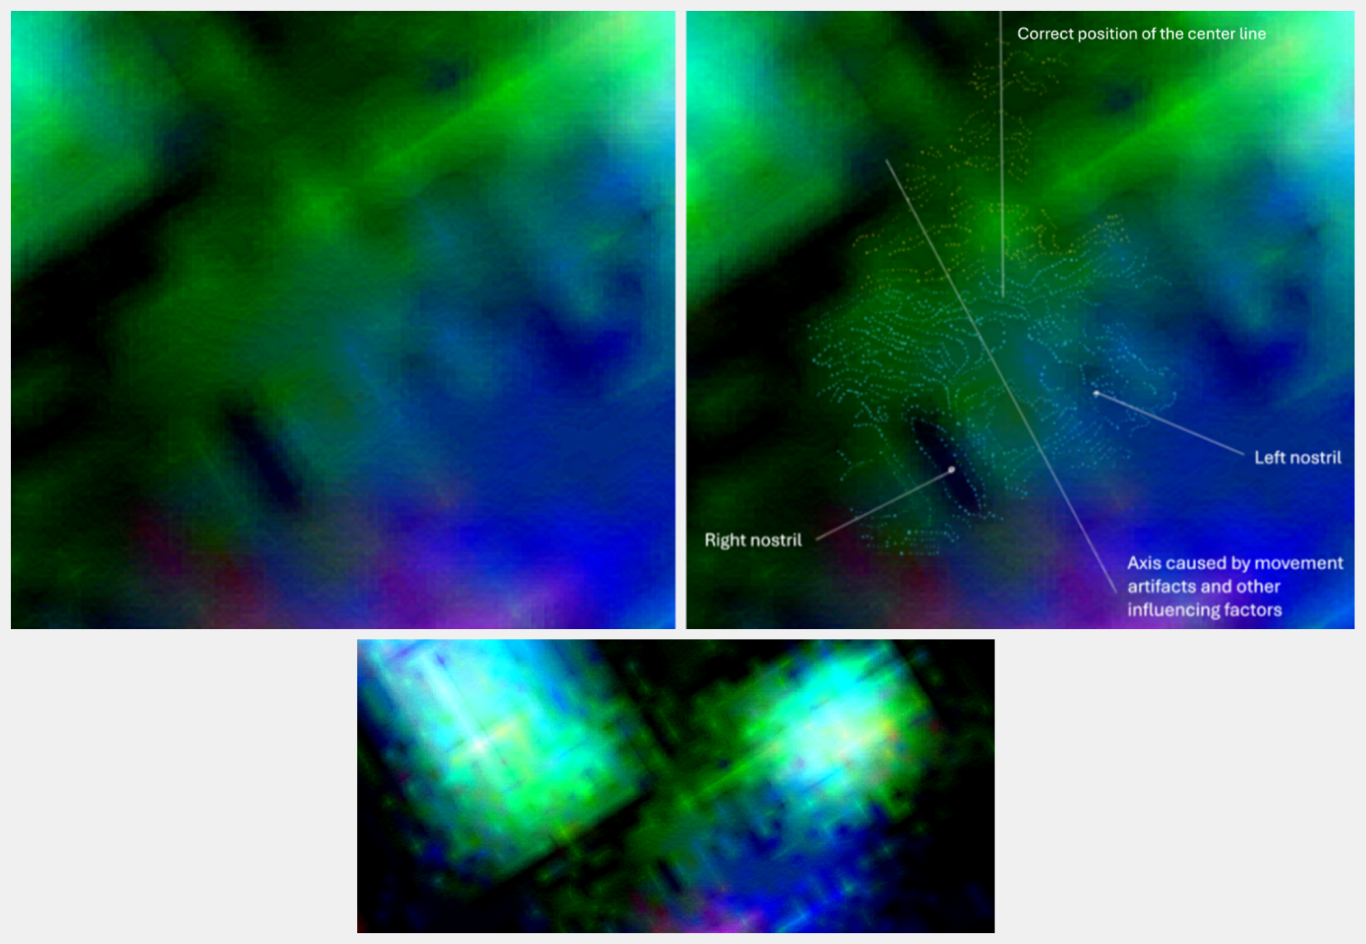
Figure 3.10: Indication of Spatial Structure (Corresponds to Figure 9.2.5)
As in all the images, the left and right nostrils (nasal openings) are discernible here, though the left nostril appears less defined. The pattern of the artifact or structural lines in this area is noteworthy: at both nostrils—and particularly the right one—the distinct course of the lines clearly shows them extending from the outer edge of the nostril into its internal structure. This phenomenon of three-dimensionality within a two-dimensional image space represents another anomaly among the findings as a whole. Furthermore, the line pattern in the area under examination suggests the presence of a nasal tip, as the lines converge toward a central point of the structure, terminating in a circular arrangement around it. Extending downwards from the columella, artifact lines are visible that curve outwards to the sides in a semicircular fashion.
Thus, the entire area under examination is characterized by three-dimensionality. In addition, the entire nasal region displays a uniform green coloration that distinguishes it from the surrounding area. Note: Artifact lines are visible across the entire ROI and around the nasal structure itself. However, outside the area under examination, these lines lack definition and do not exhibit the coherent relationship seen in the artifact lines associated with the nasal structure. This specific three-dimensional area is not found in any other detail of the respective ROI.
Additive Configuration Parameters for Fig. 9.2.5: Brightness: +32%, Sharpness: +80%.
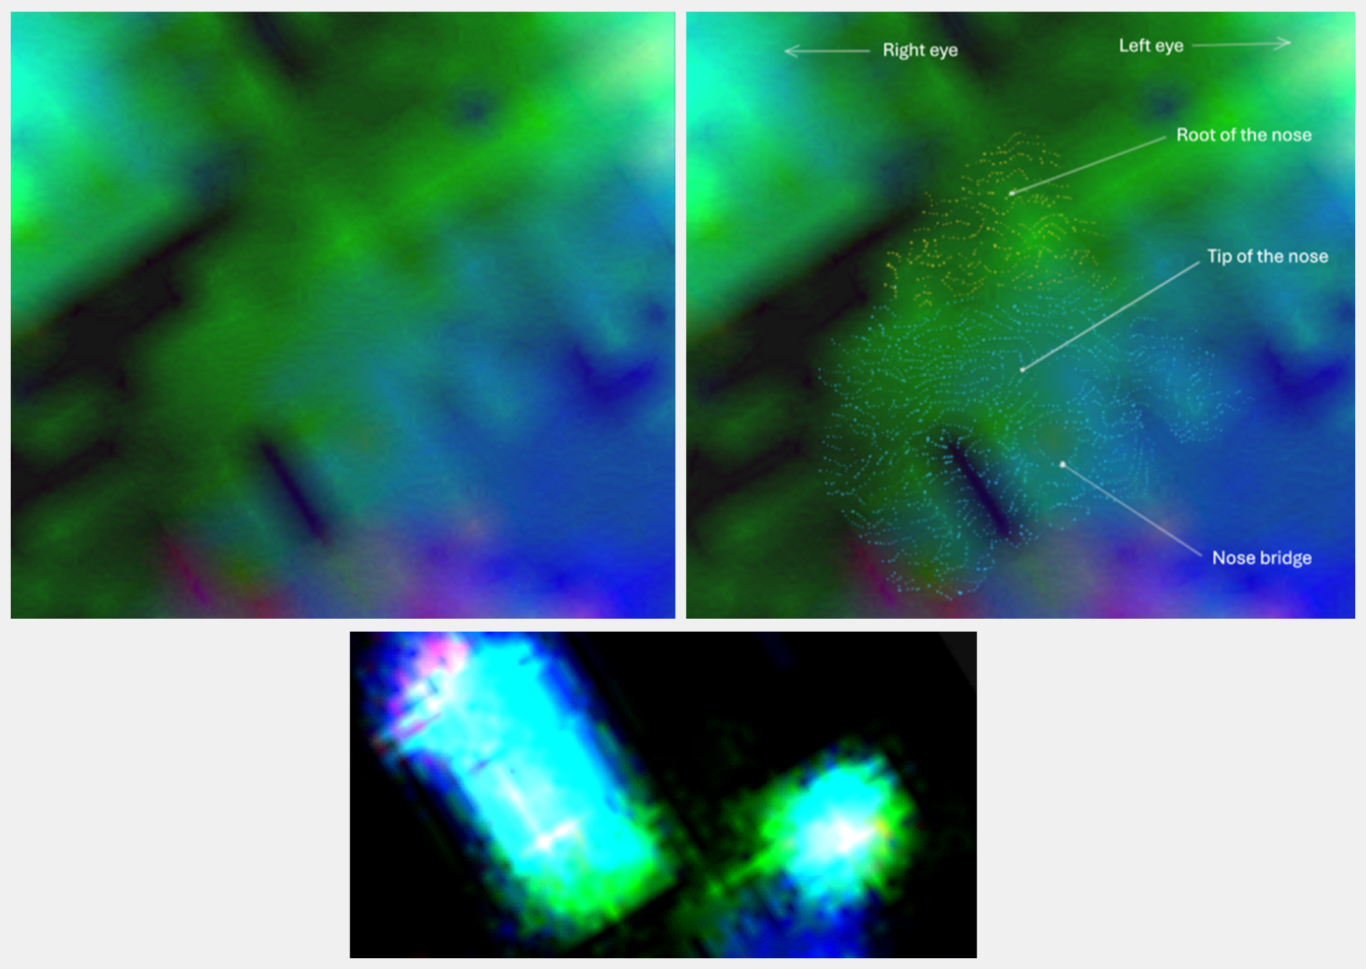
Figure 3.11: Three-Dimensional Artifact Structure (Corresponds to Figure 9.2.6)
To highlight the three-dimensional nature of the area, the artifact lines of the region under investigation—shown in the upper right image—have been traced in this collage as well. The same visual observations noted previously are evident here too: this area possesses a clearly three-dimensional structure, which constitutes an anomaly given the prevailing imaging conditions.
Additional Configuration Parameters for Fig. 9.2.6: Brightness: +73%, Sharpness: +100%.
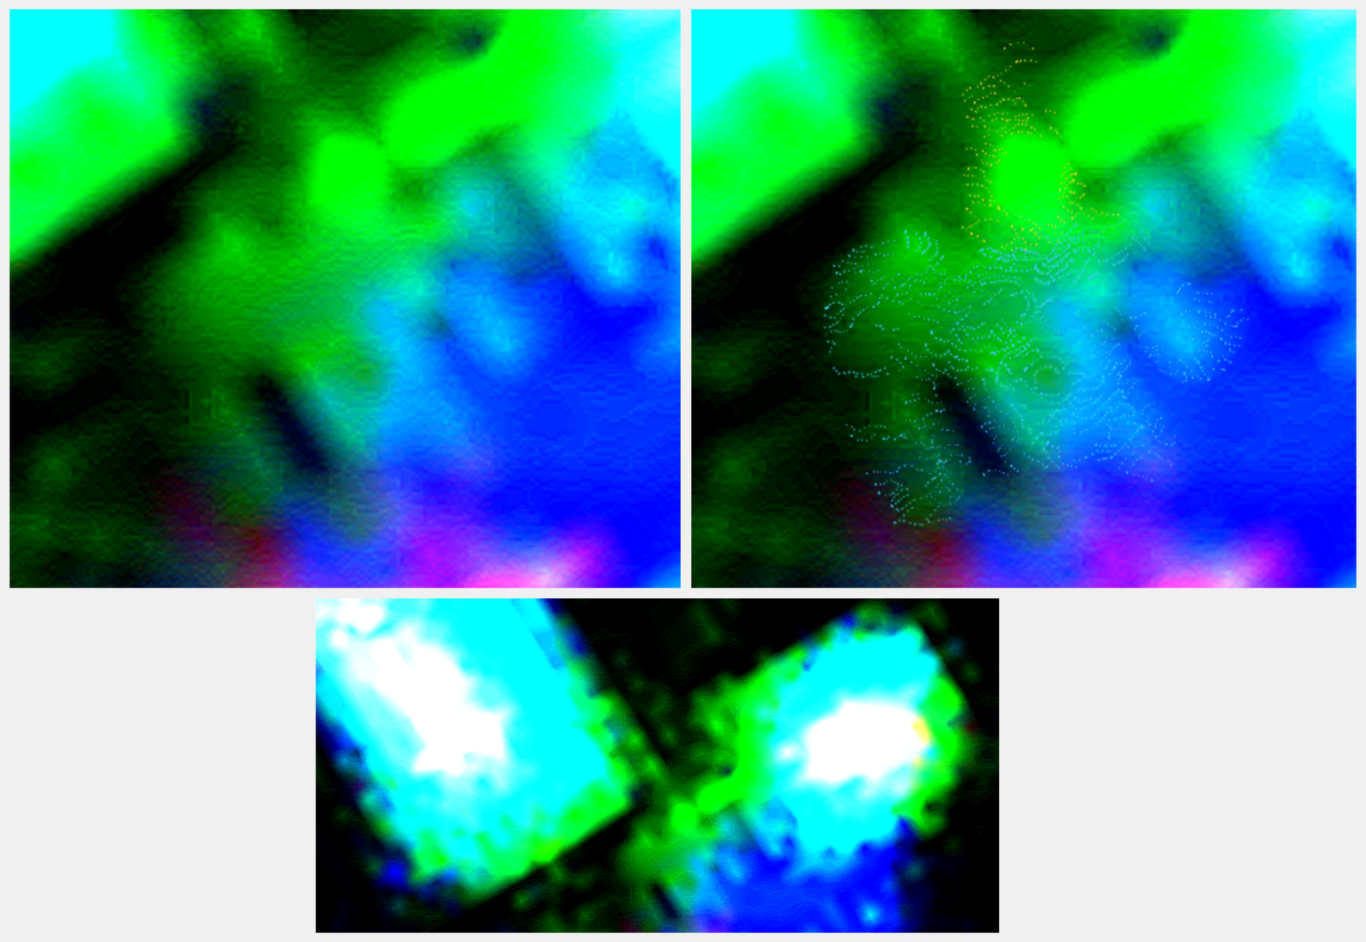
Figure 3.12: Homogeneous Coloring & Spatial Artifact Line Aarrangement (Corresponds to Figure 9.2.7)
The tracing of the artifact lines in the right-hand image stands out clearly against the dark green nasal area, vividly illustrating the phenomenon of three-dimensionality captured within a two-dimensional image space. The nasal area as a whole is distinguished from its surroundings primarily by its uniform coloration. The orange traced area marks the bridge of the nose. Lateral extensions of these lines are partially semicircular, indicating the transition from the nasal bridge to the surrounding facial area. Furthermore, the use of orange and blue clearly shows that the lower section—comprising the nasal tip, columella, nostrils, and part of the nasal bridge—has rotated away from the correct vertical nasal axis due to movement.
Additive Configuration Parameters for Fig. 9.2.7: Brightness: +20%, Sharpness: +100%.
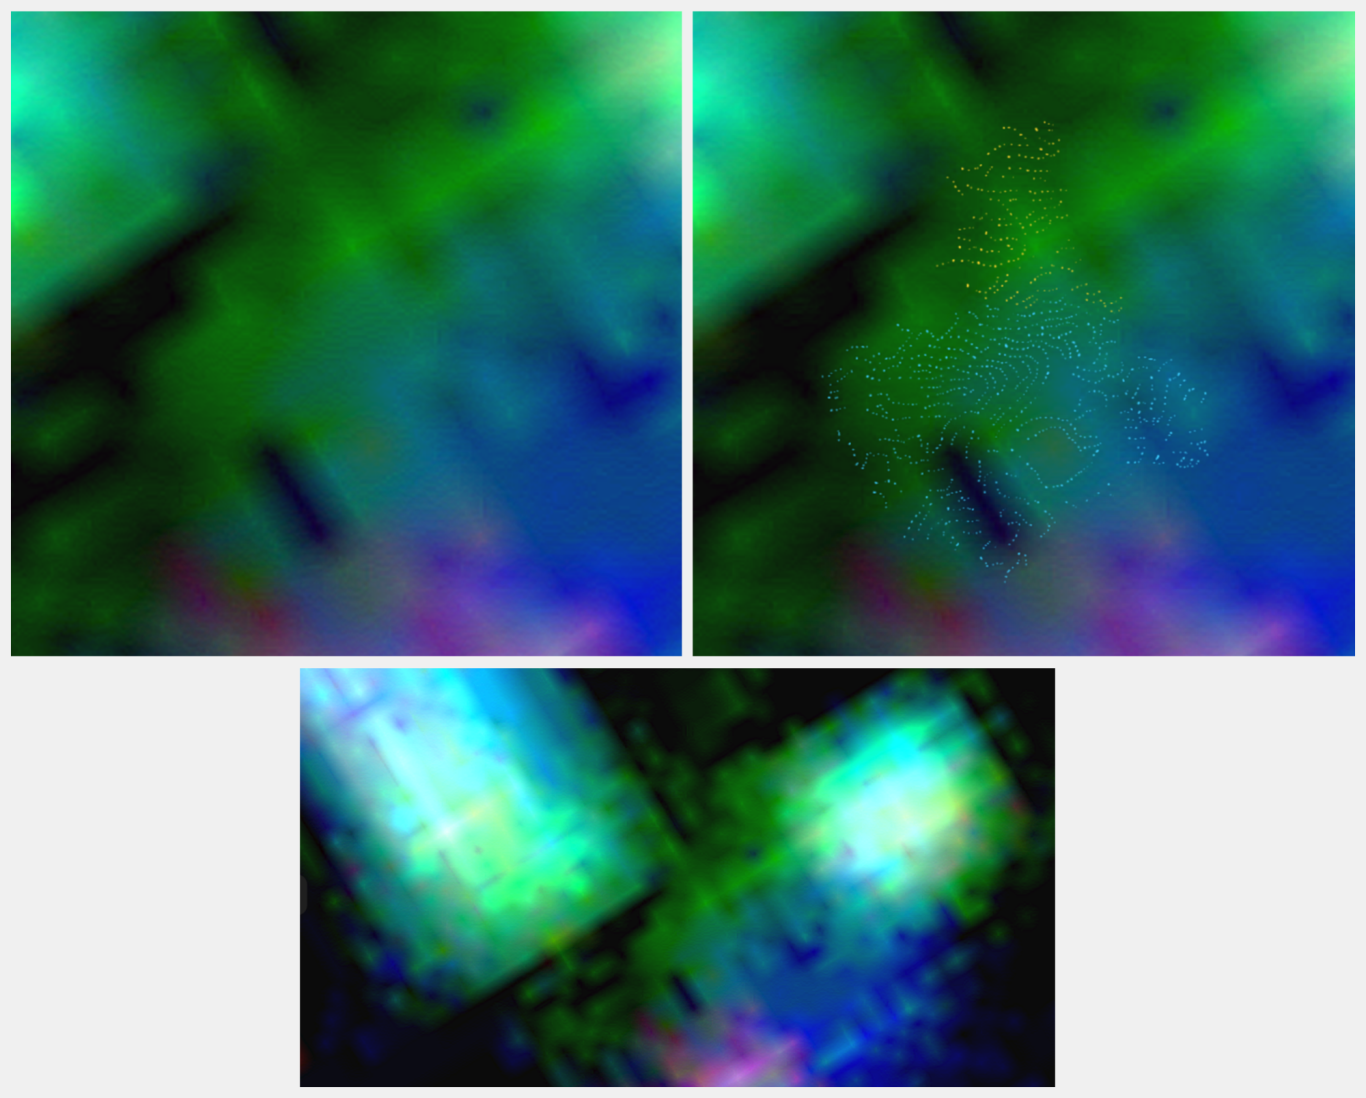
Figure 3.13: Axis Reference and Nasal Root (Corresponds to Figure 9.2.10)
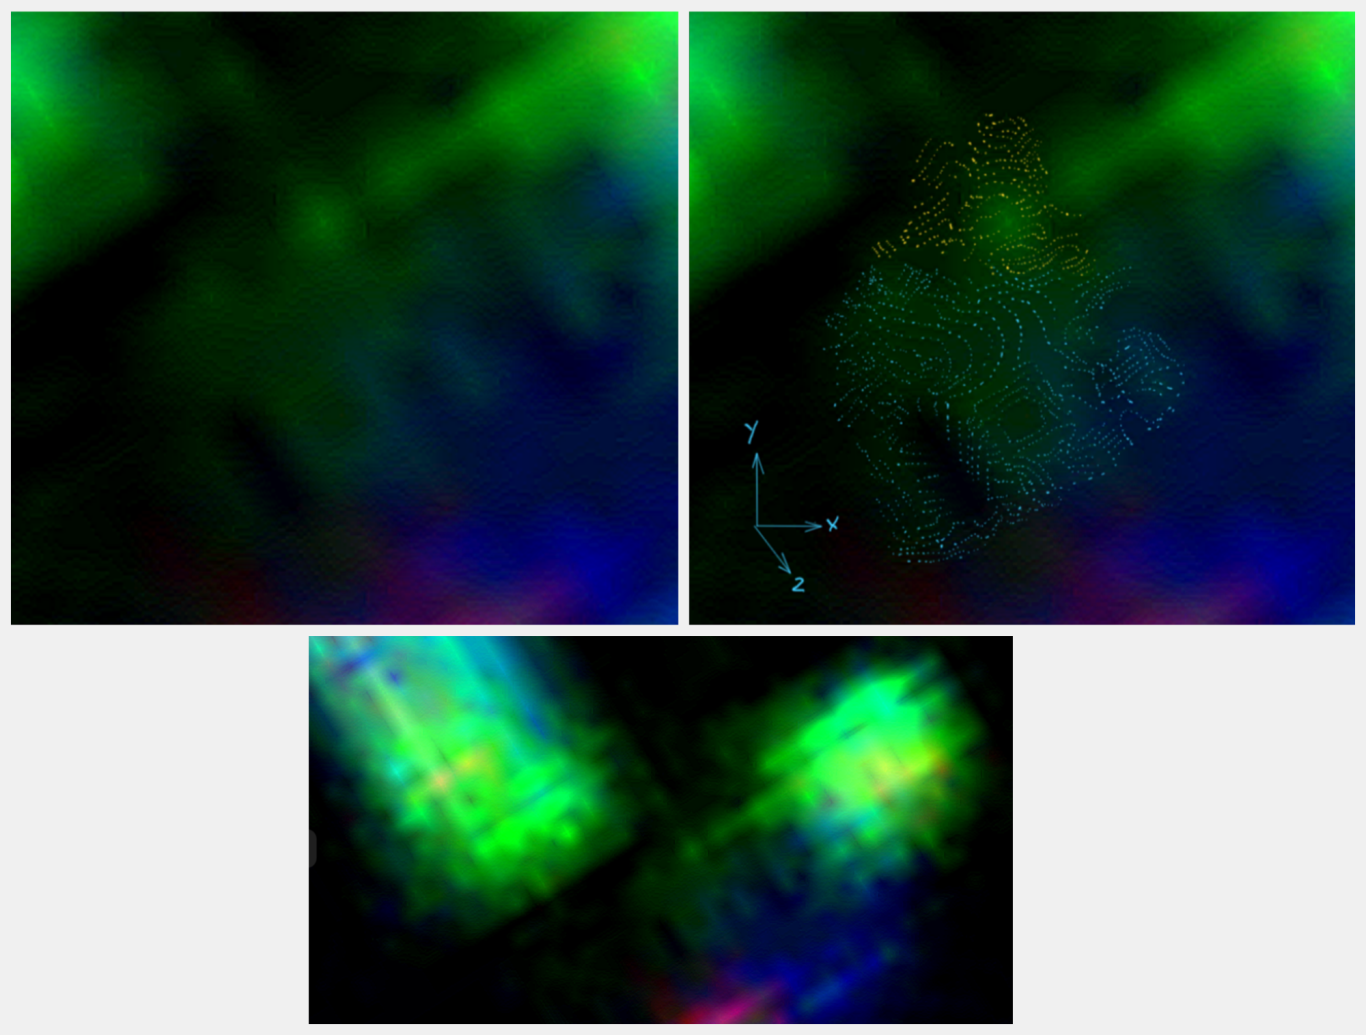
The result of the additive configuration enhancement here produced a very dark green appearance in the area under examination. The tracing of the artifact lines in the right-hand image—marked in orange and blue—highlights the nasal root and the nasal bridge (with its tapering artifact lines indicated by orange dots) in the upper section. The lower blue tracing illustrates the axial shift away from the correct position by following the artifact lines. The curved lines run uninterrupted from the nasal tip to the columella. At the right nostril, it is clearly visible that the artifact lines extend into the opening. Overall, this feature highlights the phenomenological three-dimensionality present in the examined area. The superimposed axis system (X, Y, and Z axes) serves to illustrate this three-dimensionality.
Additive Configuration Parameters for Fig. 9.2.10: Brightness: +48%, Sharpness: +95%.
3.4 The Oral Structure
The oral structure proved to be one of the most fascinating and unexpectedly detailed features identified. Subsequent examinations of this area reveal structures whose visual analysis provides insight into the morphology of this central facial region of the entity.
Following Figures 3.14 through 3.17 illustrate the oral morphology revealed through the application of specific configuration parameters.
Figure 3.14: Focus on Oral Morphology
The image on the left shows the ROI (see Fig. 2.6) with the configuration parameters applied here. The image on the right shows an enlargement containing the mouth region and interacting elements. These elements will be discussed in detail in subsequent sections. No markers have been included here.
Configuration Parameters for Fig. 3.14: Brightness: 94%, Saturation: -60%.
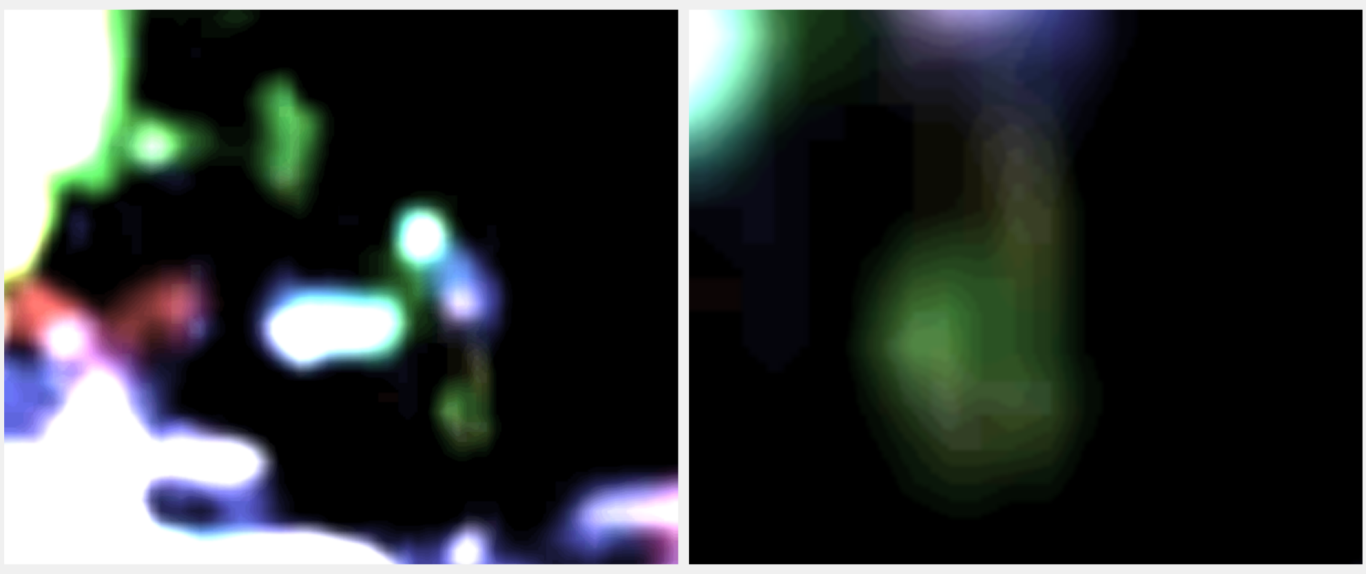
Figure 3.15: Differentiation of the Mouth Region and Light Reflection
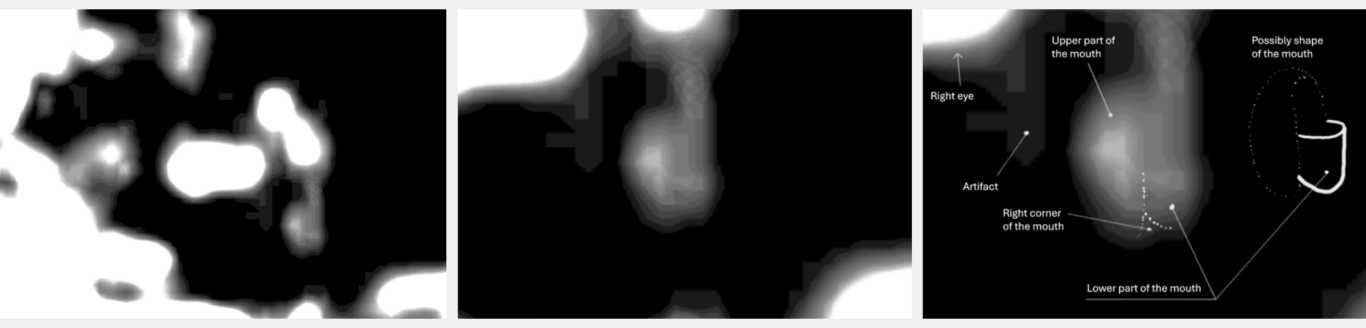
The following collage displays identical images, with the left image serving as an unobstructed view. The right image highlights specific features of the examined structure through markings: the upper lip analog is outlined in white in the left section of the image, while the lower lip analog is outlined in the lower right section. A lighter-colored area stands out on the upper lip; this appears to be a reflective surface. The entity's right eye is visible at the upper left edge of the image. The mouth appears to be open, and there are interacting elements within the image space that seem to be connected to the mouth.
Configuration Parameters for Fig. 3.15: Brightness: 94%, Saturation: -60%.
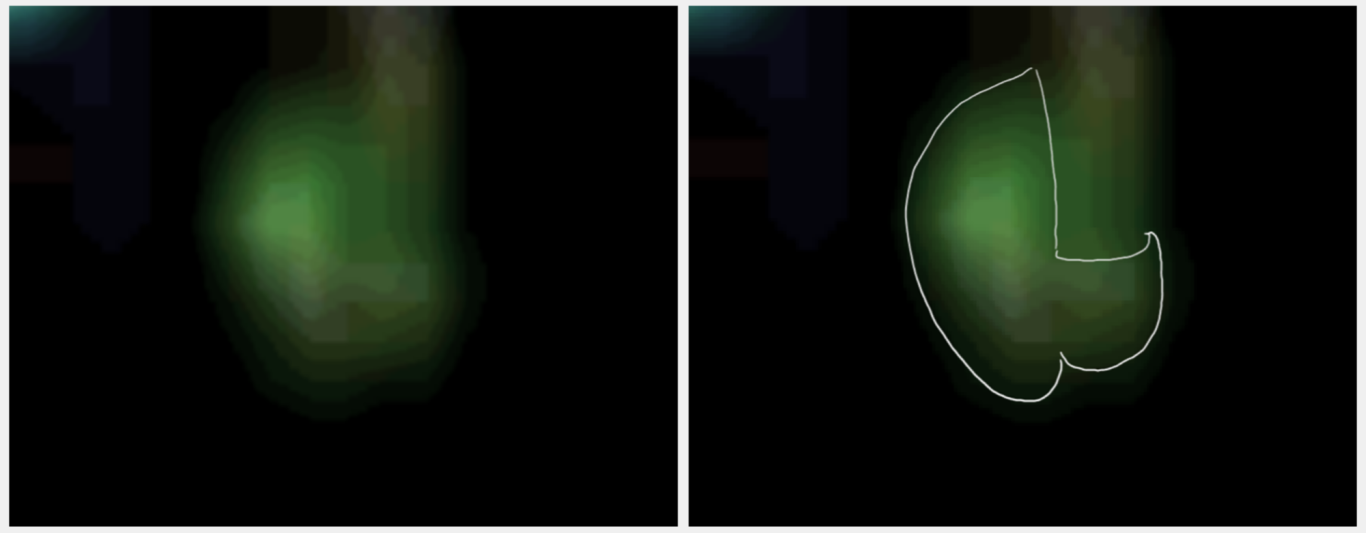
Figure 3.16: A Striking Illustration of the Right Corner of the Mouth
This three-image collage shows, on the left, an overview (ROI crop; cf. Fig. 2.6) using the configuration parameters applied here. The result of these adjustments is a high-contrast, distinct rendering in which all structures stand out sharply against the background. The applied configurations enable a clear differentiation from the surroundings, thereby highlighting the presence of these structures within the two-dimensional image space. The previously mentioned interacting elements extending toward the oral structure also stand out from the background and exhibit a characteristic shape. Parts of the right eye—specifically its immediately reflective areas resulting from active luminescence—are visible in the upper-left section of the image.
Middle image: The mouth region and interacting elements shown in an enlarged view of the ROI.
Right image: Focus on the mouth region: Further magnification reveals specific details that have been marked. This high-contrast rendering allows for the identification of the right corner of the mouth, with the edges of the upper and lower lips marked in color:
- The red line corresponds to the upper lip.
- The green line corresponds to the lower lip.
- The dashed lines indicate additional contours of the mouth's shape.
Configuration Parameters for Fig. 3.16: Brightness: 98%, Contrast: 100%, Saturation: -100%.
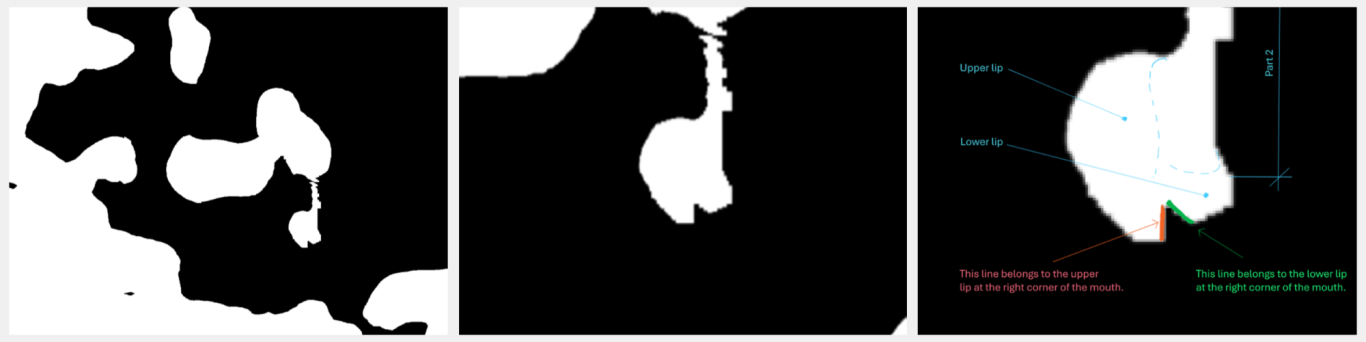
Figure 3.17: Details of the Mouth Region and Morphological Analog
This three-image composite shows the ROI on the left, using the configurations specified below.
Middle image: An enlargement of the ROI showing the mouth region and interacting elements.
Right image: The mouth region in focus. The marked indicators highlight structures within the mouth region:
- The upper-lip analog features a reflective surface.
- The dotted lines indicate the right corner of the mouth.
- A graphic representation of the hypothesized interpretation of the mouth shape is shown in isolation on the right side of the image. It is interesting to note that the "lower lip" does not appear humanoid but rather resembles a bird's lower mandible.
- Additionally, an image artifact is marked (left area of the image), as well as the lower section of the right eye and reflective areas caused by luminescence of the eye.
Configuration Parameters for Fig. 3.17: Brightness: 97%; Contrast: -26%; Saturation: -100%.
3.5 The Supply Unit (External Feeding Element)
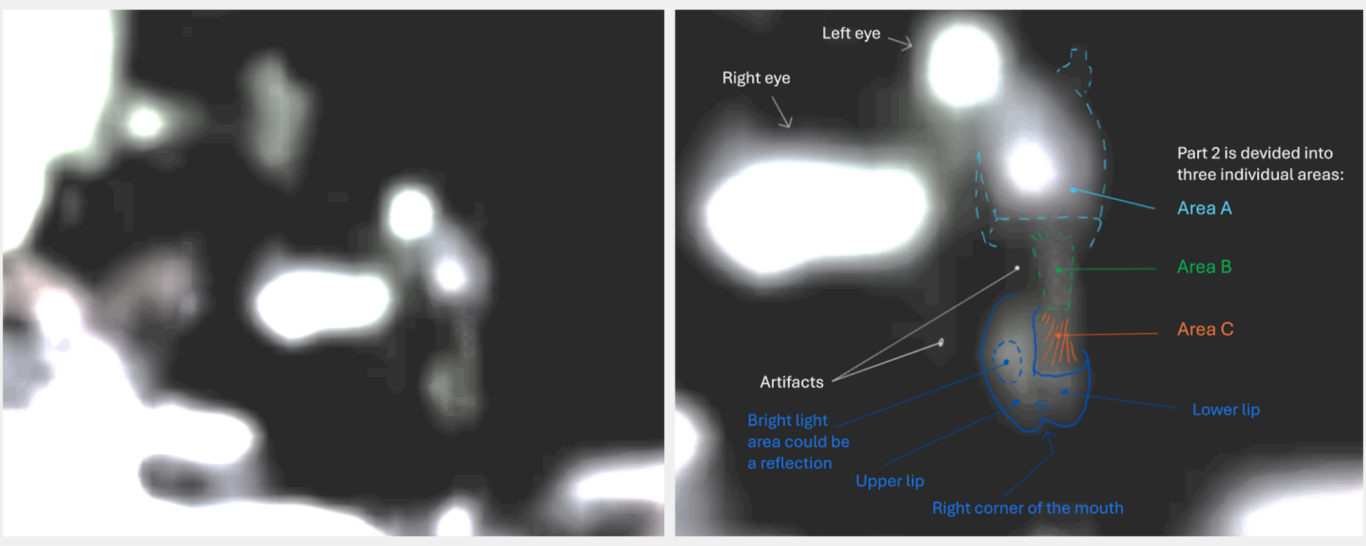
Structures enter the frame from the left side of the face, extending from below the left eye toward the center of the face/oral structure. These structures can be divided into three areas:
Identified Elements (Image Labels)
- Area A (Reservoir): An initially undefined structure enters the frame from the left edge of the face and is located in the image space below the left eye. This structure has been identified as a reservoir for holding a liquid or a semi-solid food mixture.
- Area B (Tube): An elongated structure connected to the reservoir. It attaches to the lower section of the reservoir and extends toward the oral structure.
- Area C (Fluid): This detail is not a structure comparable in material terms to the reservoir or the tube. It appears to be liquid or paste-like in nature and extends in a broad stream from the end of the tube toward the oral structure.
Note: The hypotheses regarding the supply system presented here have been refined and elaborated upon through the use of modern AI-powered analysis tools.
Figure 3.18: Elements of a Supply Unit
The configuration parameters applied reveal three elements that clearly enter the frame from the left side of the face and extend from below the left eye toward the oral structure. Based on their structure, these interacting elements can be categorized into the areas marked in the image on the right: Areas A (Reservoir), B (Tube), and C (fluid medium).
Configuration Parameters for Fig. 3.18: Brightness: 96%, Contrast: -57%, Saturation: -96%, Shadows: -100%.
3.5.1 Visual Analysis of the Tank (Area A)
The element entering the frame from the left edge of the face—identified as a tank (Area A)—represents the core component of the supply unit. It evidently functions as a storage vessel for the fluid (nutrient slurry/chemicals) identified in Area C and, based on the primary metric analysis following this exploratory study, appears fundamental to the maintenance of the hypothesized Constructed Biotechnological Entity (CBE).
This section focuses on a detailed examination of the area in question, which forms a distinct geometric shape. Hypotheses regarding material properties and the method of connection to the facial periphery are proposed. The analysis is based on visible artifact lines within the two-dimensional image space; this process allowed for the differentiation of these lines and the identification of structural relationships between them.
Given its function as a central energy store (material depot), the precise documentation of its visible surfaces and connection points is relevant to assessing the efficiency and durability of the overall system. The tank's structure suggests that the entity relies on external material resources. The interpretation of its functionality, along with the implications of these external structures for the overall hypothesis regarding the entity, is discussed in Chapter 4 (Analysis Results & Outlook).
Note: The term CBE refers to an initial classification of this entity—identified as a key finding in the main study (see reference at the top of the page)—derived through a process of elimination and observations made during the 1987 NHI encounter (see Analysis, Ch. 1.2).
Figure 3.19: Initial Identification and Localization of the External Structure (Tank)
General visibility and morphology: The previously examined facial morphology is visible. The configuration settings were chosen to place the tank ("Area A") in focus. The marked element enters the frame from the left edge of the visual field. Examination of the artifact or structural lines revealed a morphology with the following characteristics:
- Identified Surfaces: Detailed analysis of the artifact lines depicting the tank indicated the presence of various surfaces which, when viewed together, form the structure of a container. These details could be distinguished based on the phenomenologically structured orientation of the artifacts. The markings in the right-hand image illustrate a base, a front side (facing the viewer), and a right side wall. Note: No definitive conclusions regarding the tank's actual shape can be drawn here; the container could possess more than the assumed four side walls (a rear wall is also presumed), feature sharp or rounded corners, or even be entirely rounded. The term "walls" is therefore based solely on the artifact structure.
- Orientation: The shape, resembling a container (tank), appears tilted upward from the vertical, making its base visible.
Specific Details
- Light Reflection: A bright area of light is visible on the front side. This is a reflective surface created by the luminescence of the eyes and the light from the bright UAP foreground (presumably incident moonlight given the open UAP foreground).
- Connection to the Tube: A tube-like extension (Area B) connects to the base and extends toward the oral structure.
Imaging Reference: The left image provides an overview. The inset within the left image shows the full view of the ROI (cf. Fig. 2.6) using the configuration parameters listed below.
Configuration Parameters for Fig. 3.19: Brightness: 94%, Saturation: -70%.
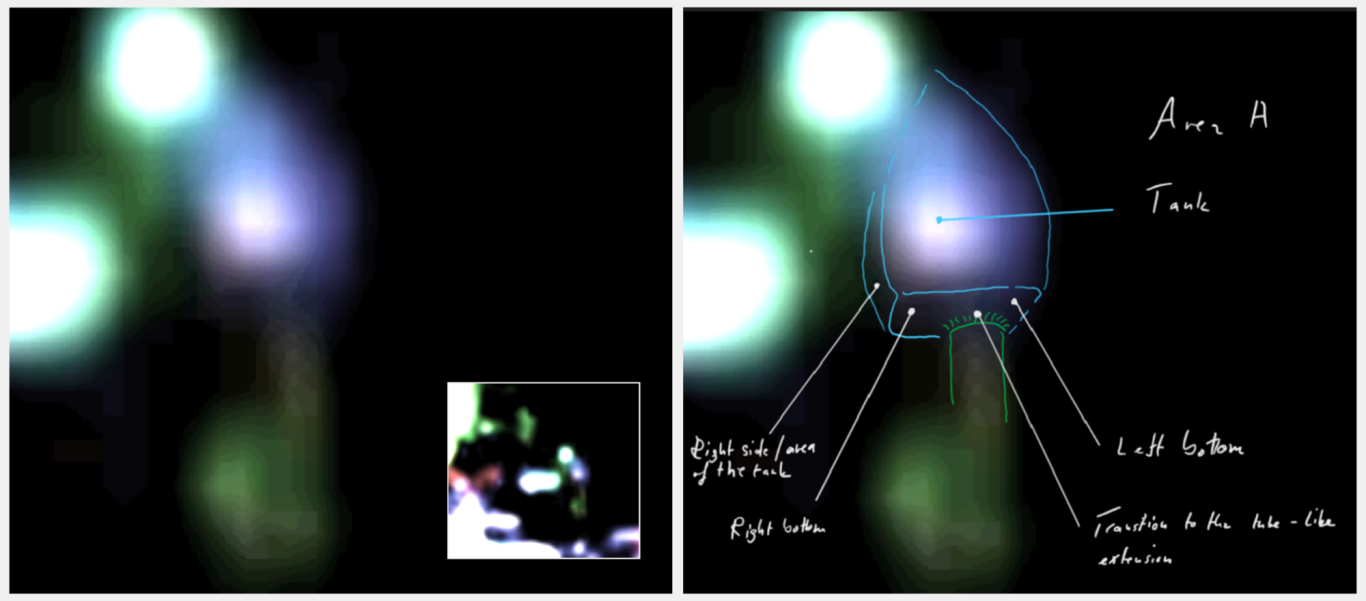
Figure 3.20: Analysis of Two Artifact Types
The configuration parameters applied here were selected to make the artifact lines stand out clearly. These can be differentiated into two main categories based on origin, approach, and coloration:
- Black-violet/pink lines associated with the tank (labeled "Object" in the illustration) (dotted blue)
- Green lines created by the luminescence of the right eye (traced in yellow)
Image Orientation: Left image for overall view, center crop for unobstructed view, right crop with markings.
The Tank (black-violet Artifacts): The artifact lines correlating with the tank exhibit a black-violet/pink coloration. The base area of the tank can be distinguished from the surrounding regions by shading. The angular and sharp-edged path of these lines indicates a container-like shape. These lines form corners and edges that demarcate the bottom section from the front and the right side of the tank. Note: This geometric classification is based on the characteristic appearance of the artifact lines; it is not possible to infer the actual shape of the tank. The corresponding terms are retained for the sake of descriptive simplicity.
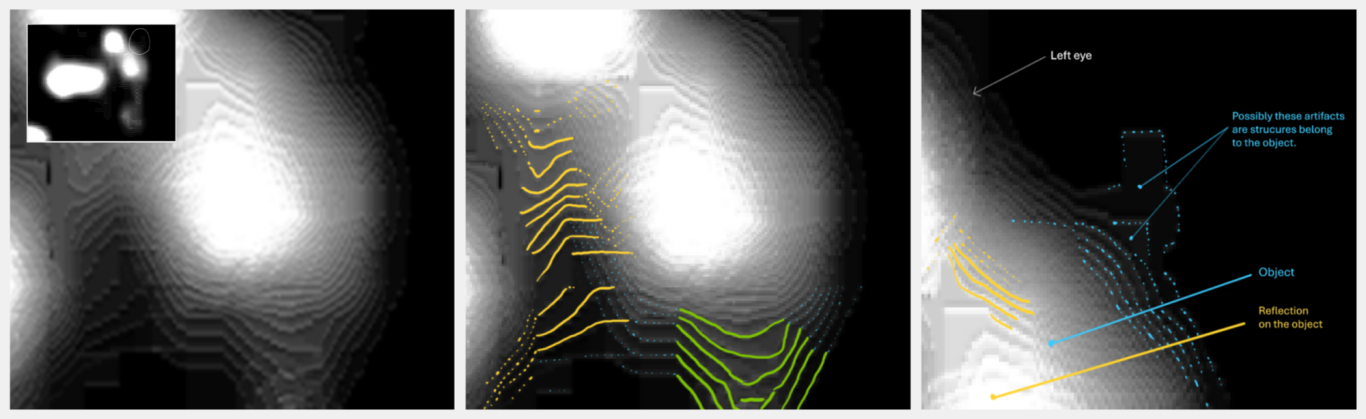
Light Artifacts and Transitions: Artifact lines generated by the luminescence of the right eye (yellow markings) show a direct correlation with the right ocular. The reflective surface on the front of the tank (white area) tapers off into white artifact rings that visually appear connected to the luminescence artifact lines. This reflection is likely produced by both light sources: the luminescence and the bright UAP foreground.
The Tube: A conical element adjoins the base area of this tank; it apparently channels the identified fluid (Area C). The transition from the tank to the tube differs from the structure of both the tank and the tube (green markings). This indicates a difference in material composition.
Material Evidence (Interaction of Lines): The interaction between the two types of artifact lines is of particular analytical interest. The greenish artifact lines (marked in yellow) appear to lie entirely above the black-violet artifact lines of the tank, or completely obscure them (see the right side of the tank, on the left in the image). The light artifacts appear transient (transparent). In areas completely covered by the light artifacts, a clear interruption of the tank's visible artifact lines can be observed. This phenomenon provides an indication of the material (physically solid) structure of the tank.
Configuration Parameters for Fig. 3.20: Brightness: 94%, Saturation: -70%, Sharpness: 100%.
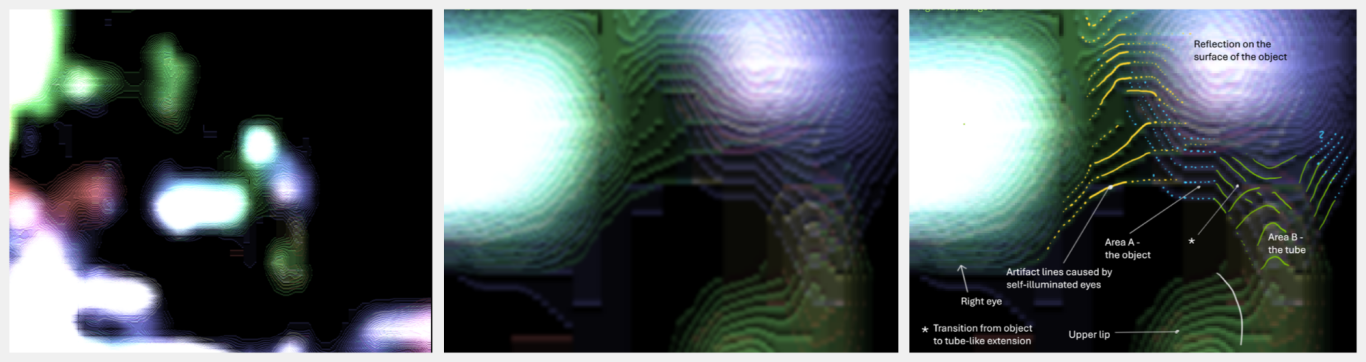
Figure 3.21: Note on the Materiality of the Tank
Image Orientation: The overview (inset in the left image) shows the overall view of the configured ROI (see Fig. 2.6). The left and center images focus on the tank (Area A), with the center image containing markers. The right image shows an enlargement (see marking in the inset) with a focus on another image detail.
Materiality of the Tank (left and middle Images): The applied configurations highlight artifact lines that arise from the luminescence of the right eye and correspond to reflections (see yellow markings). An interesting feature could be observed based on the visual positioning of these lines in the two-dimensional image space: these artifact lines overlay the underlying artifact lines of the tank. This phenomenological feature, as well as the reflection on the front of the tank, point to the materiality of the tank.
The artifact lines associated with the tank's basal structures (the floor) are also visible (black/purple lines). They form a self-contained, differentiated shape and give the visual impression of a seemingly angular and angular shape of the tank. As already mentioned, this may be a characteristic expression of the artifact lines and may not correspond to the actual shape. The conically shaped tube begins at the bottom (green lines in the middle picture), which runs to the oral structure. The tank is referred to as an "object" in the figure.
Right Image: The extended section highlights a separate detail that is visible as a faint artifact to the left of the tank. Whether it is an associated element of the tank (e.g. a suspension or a control/valve element) or an undifferentiated artifact cannot be determined in more detail since similar structures are located in the ROI. However, since similar structures appear less structured compared to the detail, this structure was hypothetically highlighted here.
Configuration Parameters: Brightness: 94%, Contrast: -30%, Saturation: -100%, Shadow: -100%, Temperature: -30%, Sharpness: 70%.
3.5.2 Detailed Analysis of the CBE-Serving Supply Unit
A functional analysis is presented below. To understand the mechanisms of the apparent power supply, the structure was broken down into its components. For this purpose, the corresponding supply area was divided into three logical regions: tank (A, blue markers), tube (B, green markers), and fluid interface (C). The following figures document the morphological properties of the individual components.
Figure 3.22: Component Analysis: Tube (B) and Liquid (C)
- Detailed View of the Transfer: The elements are viewed together because they are directly connected as a supply line. A tube is connected to the tank inlet. Its diameter decreases along its length. This constriction could indicate that the tube functionally resembles a nozzle to precisely direct a liquid flow.
- Tube Characteristics: The structural lines characteristic of the tube (traced in green) suggest a material composition different from that of the tank. This assumption is based on the transition zone between the tank bottom and the tube, as the artifact or structural lines are clearly distinguishable from one another in this area. No such characteristic structure is observed on the tank, as it is largely obscured by reflections.
- Liquid/Interface: A liquid (substrate) apparently emerging from the tube in a jet-like manner appears transparent and extends into the white-bordered mouth structure (mouth interface).
Configuration Parameters for Fig. 3.22: Brightness 92%, Saturation -85%, Sharpness 50%.
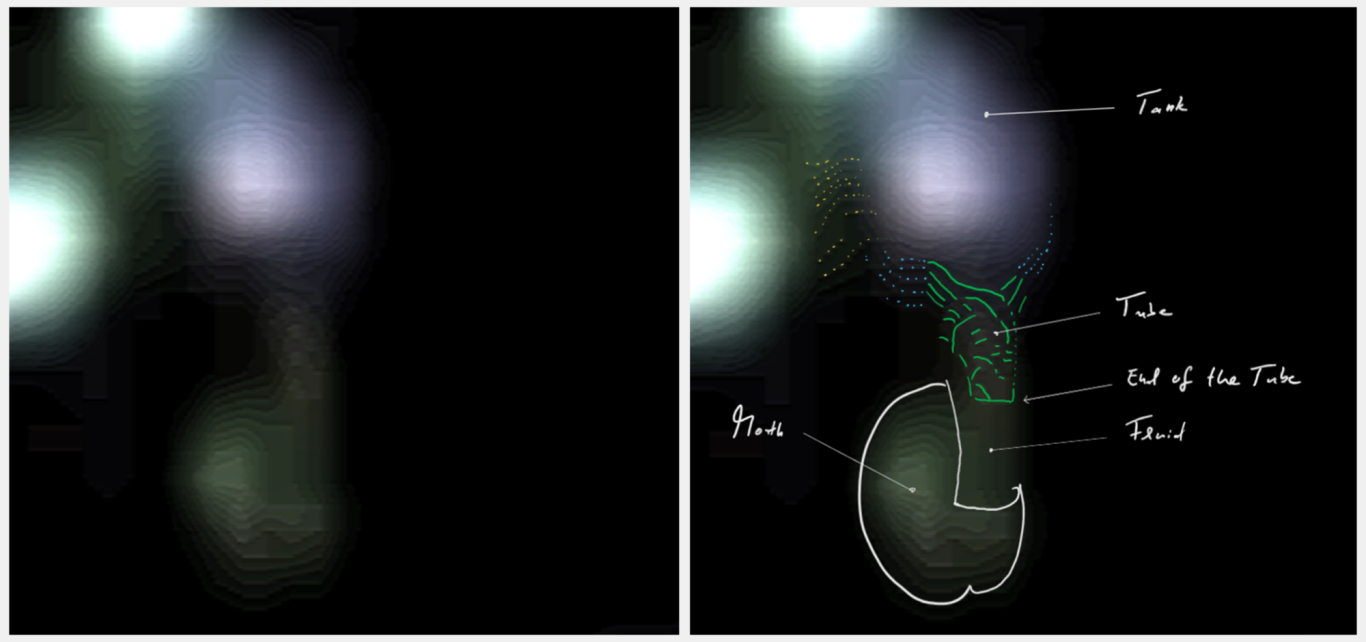
Figure 3.23: The Liquid Medium (C) as the Transport Medium for the Energy Supply
This figure shows the relevant image section with optimal visibility parameters. The areas of the Tube (B) and the Exit Medium (C) are considered together, as they are directly connected as a supply line.
1. Analysis of the Tube (Solid Matter): The characteristic structures of the tube are clearly outlined (green markings). Reflective areas can be identified on the tube (visible along the tube on the right/front side). These are a strong indication that the tubule structure is made of solid matter and is therefore physically present in three-dimensional space. The light sources responsible for the reflection are the luminescent eyes and the bright UAP foreground.
2. Analysis of Area C (Liquid Medium): At the lower end of the tube, Area C connects, which is interpreted as a medium of liquid consistency. In contrast to the characteristic structure of the tube, Area C is distinguished by a homogeneously weakly colored area, giving the appearance of transparency.
- Consistency: The assumption of a slurry or liquid consistency is supported by the fact that this area appears transparent and with a weak color intensity as a homogeneous area across all adjustment combinations.
- Reflection Behavior: The transparent medium shows no visibly reflective surface under these adjustments, whereas a medium like clear water could be expected to reflect. The observation that the transparent medium does not visibly reflect, suggests that it is either a highly viscous liquid or a colloidal/slurry substance. Alternatively, surface tension or the adjustment combination might suppress the reflection.
3. Morphology and Flow Dynamics (Nozzle Function): The analysis of the tube geometry at the transition to Area C provides important clues about the nature of the transport:
- Geometry: The tubule structure begins basally from the tank and runs conically, tapering significantly at its end. This shaping supports the acceleration and focusing of the exiting medium.
- Exit Behavior (Pressure vs. Passive): A stable broad jet of the transparent medium (C) is visible. This strongly suggests an active pressure mechanism rather than passive runoff (e.g., dripping or slow flow). While the possibility of an optical illusion (artifact distortion) exists, the visual evidence supports the hypothesis of a controlled release.
4. Causal Interpretation (Function): The entire structure extends from the left side of the NHI's face towards the upward-facing mouth. The transparent medium (C) begins at the end of the tube and ends very close to the mouth.
Energy Supply Process: Based on these clear causal relationships (Tank → Tube → Mouth) and the active supply via the nozzle function, the entire process can be interpreted as an energy-supplying process.
Role Distribution:
- Tube: Functions as a conduit or transport pathway.
- Transparent Medium (C): Functions as a substrate (nutrient/energy source) in liquid form, which is precisely delivered to the mouth via the pressure mechanism for ingestion.
Conclusion: The entire observed structure (the tank, the tube, and the transparent medium) can be causally interpreted as a system serving the supply of necessary substances, supporting the general assumption that the process is related to the life support or energy regeneration of the NHI (CBE).
Additional: Discrepancy in Visibility: The Role of Hypothesized Quantum Field Stabilization (QFS): The striking discrepancy in visibility—the clear detection of detail in the CBE supply system (Tank, Tubule Structure, Medium C) in contrast to the almost complete, artifact-laden visibility of the "normal Greys" positioned further forward in the bright UAP foreground —requires an explanation that goes beyond conventional illumination.
Hypothesis: Quantum Field Stabilization of the Supply System: Since the analyzed CBE is presumably anchored in the observation space itself through a form of Quantum Field Stabilization (QFS), it is plausible to assume that the life support system directly connected to it is also integrated into this effect.
- Functional Necessity: The supply system (Tubule/Medium C) is causally linked to the life support of the CBE. For efficient energy or substrate transport, it must be physically just as stable and real as the host. A non-stabilized supply line would interrupt the transport.
- Physical Integration: The QFS aura of the CBE could extend to all directly physically connected components. The clear visibility of the solid tubule (B) and the liquid medium (C) would thus be a secondary effect of the CBE's stabilization.
Contrast with the Greys: The "normal greys" in the foreground (lacking yellow eyes) are apparently more visible, yet their outlines are less distinct compared to the examined CBE. The highly defined edge sharpness of the CBE structures (SD: 0.01) and its supply system represents an anomaly within the examined two-dimensional image space under the given imaging conditions.
There are two possible explanations for this:
- Stable Connection: The CBE is apparently firmly anchored in the image area through Quantum Field Stabilization. The connected supply system (Tubule and Medium C) is automatically co-stabilized to ensure fluid transport. This is why these parts are visible.
- Instability: The other Greys in the foreground are either not stabilized and are therefore blurry, or they exhibit an extremely low level of light reflection.
The decisive difference arises from the direct physical connection to the stabilized CBE, whose highly differentiated morphology is thereby rendered visible and analyzable.
Conclusion: The clear detection of detail in the tubule and Medium C is a strong indicator that the entire energy supply system is integrated into the CBE's Quantum Field Stabilization protocol to guarantee the physical reality of the transport process.
Configuration Parameters for Fig. 3.23: Brightness 92%, Saturation -85%, and Sharpness 50%.
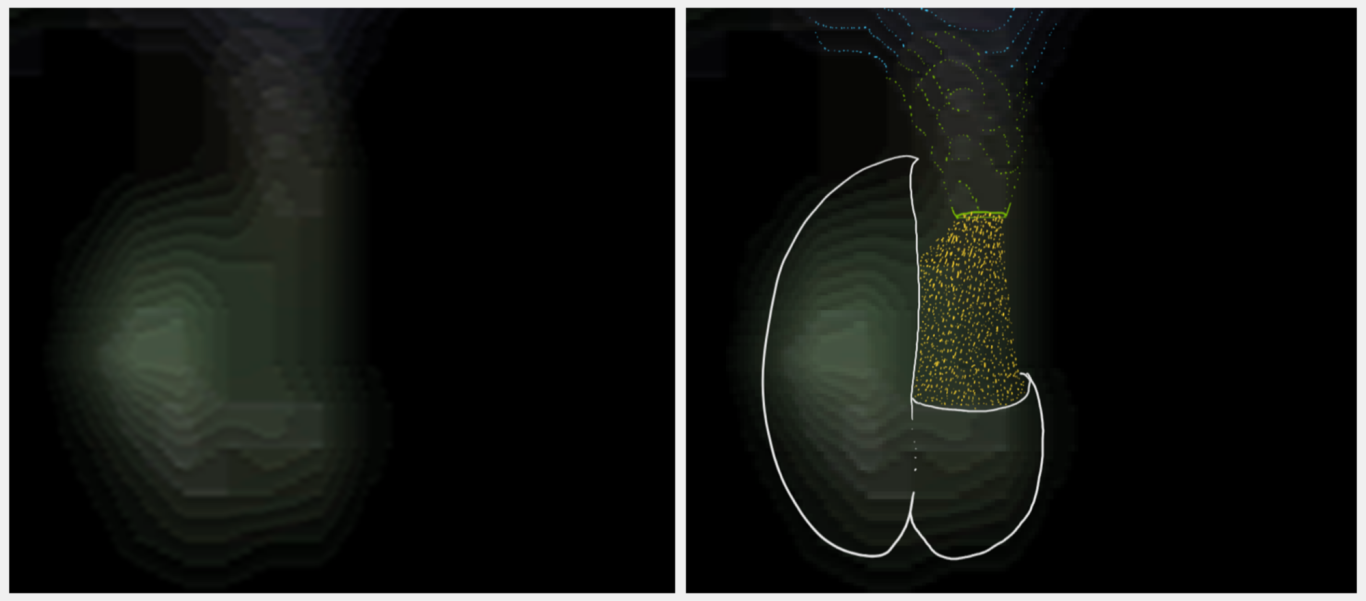
Phase Transition and Energy Supply: Physical Hypothesis of the Hybrid Supply Process
When viewed in conjunction with the active luminescence of the eyes, the following gallery provides strong evidence of the entity's integrity within the two-dimensional image space and of its bio-technogenic existence. While the structural analysis of the face clarifies its identity, the visualization of the "liquid phase" (area C) reveals the underlying life-sustaining and energy-regeneration mechanism.
Here we observe a hybrid uptake process: This is not purely biological nutrient intake, but rather the highly specialized supply of a substrate that fulfills both biological maintenance and technological energy requirements. The transition from the solid transport tube (area B) to the pressurized, apparently sludge-like medium ( area C) demonstrates a physiology in which biology and technology are functionally and inextricably intertwined.
The remarkable clarity of this system — in contrast to its surroundings — is explained by the quantum field stabilization (QFS) hypothesis: a local physical anchoring that allows the supply process and its mechanical components to remain stable and visible (within our observation space). The structural stability of these features in the two-dimensional image space across six proprietary analysis filters confirms that we are not seeing image artifacts, but rather an active, documented process.
Gallery 5: Comparative Documentation – Visual Evidence of the Liquid Phase (Area C)
The following gallery with Figures 3.24 to 3.38 serves as supplementary documentation and presents further visual evidence for the existence and dynamics of the liquid phase in the outlet area of the transport pipe (area B). The focus is on the phenomenological visibility of the two directly interacting elements, whose visual contrast clarifies the function of the supply:
- Solid Pipe (Tube): Highlighting the reflection and material structure, which confirm the physical reality of the pipeline.
- Liquid Medium: Visualization of the homogeneous transparency, flowable consistency, and flow pattern at the nozzle outlet (nozzle function).
- Regarding Figure 3.31: Despite the artifacts appearing in the image space, the applied configuration parameters (see figure caption) allow for a clear visualization of the liquid medium (C) and illustrate its direct relationship to the tube outlet (B). This image serves as basic visual evidence for the morphological interaction of these elements of the supply system, which is further investigated in Gallery 6 (Fig. 3.40).
Structural Analysis: The Supply System in Detail: To understand the significance of these images, the observed morphology is compared with known physical principles. All images presented here—featuring various combinations of configurations and based on source image 7 (cf. Fig. 2.6)—consistently show the following findings:
- The Pipe (Tube): This is not an artifact or a shadow. The light reflection on the surface indicate a solid, three-dimensional object. It functions as a closed supply line—comparable to a technically integrated "straw."
- The Nozzle Function: The pipe tapers conically at the end. In fluid mechanics, this serves to accelerate and focus a medium.
- The Medium: A substance emerges here. It is not volatile (like a gas) but has a dense, viscous consistency (a suspension or an "energetic substrate") that exits as a directed jet.
- The Target Direction: The beam is precisely aimed at the anatomically correct target – the mouth opening.
Conclusion: Random image noise would never form such a logical, technically rigorous chain of "conduit → nozzle → target point." Here we see an active, controlled supply process of a CBE (Constructed Biological Entity).
Click for full size
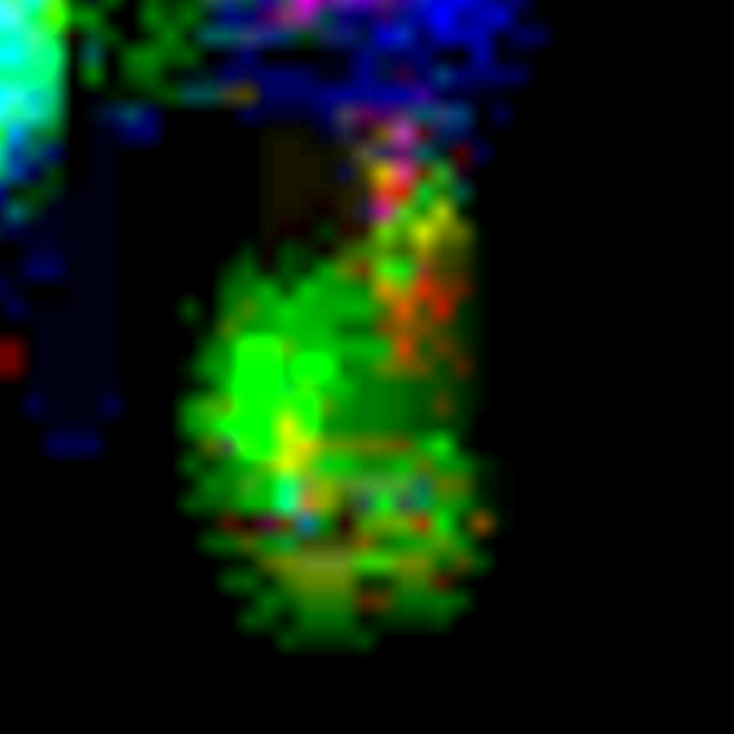
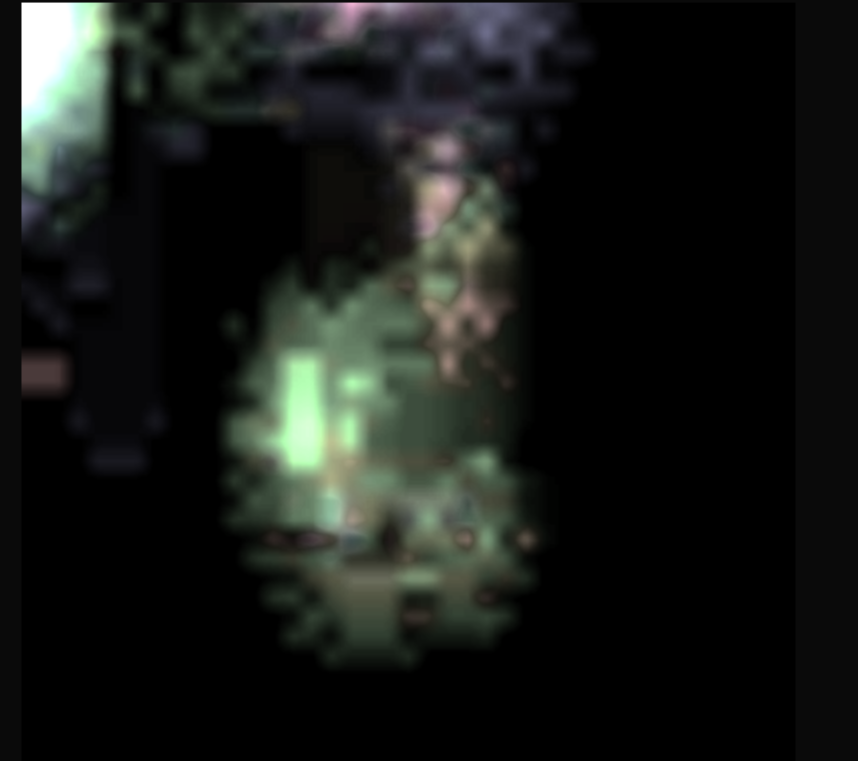
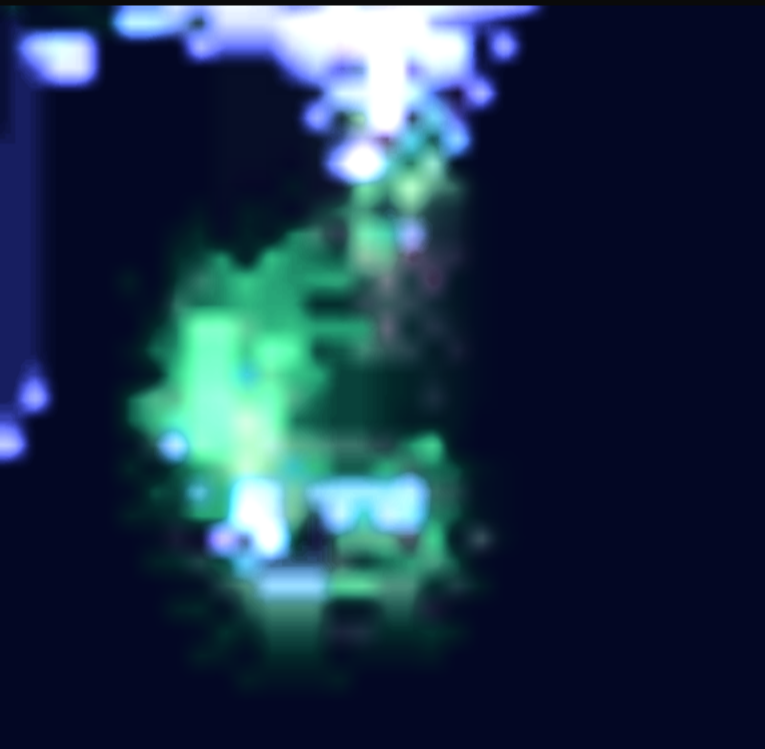
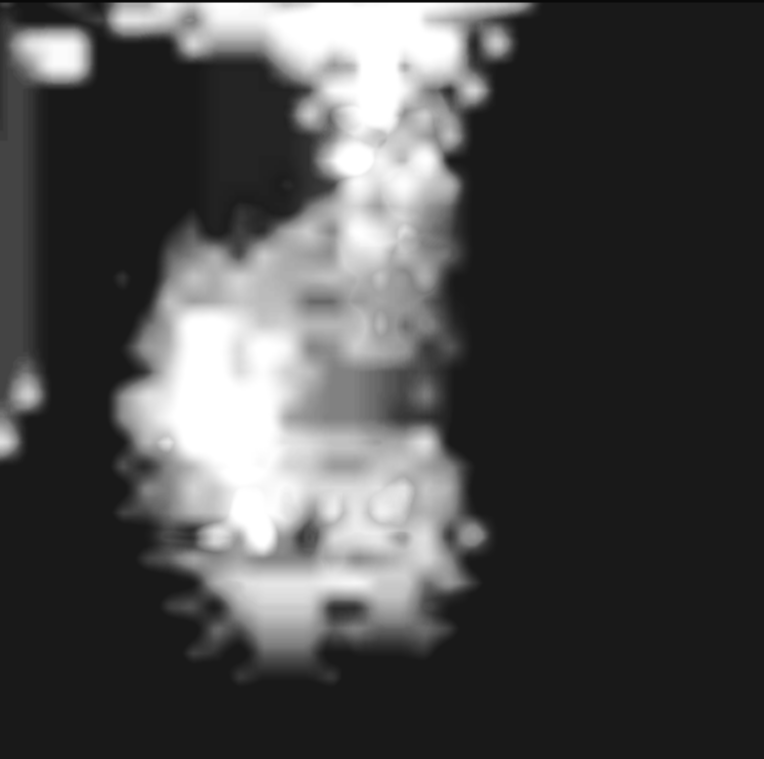
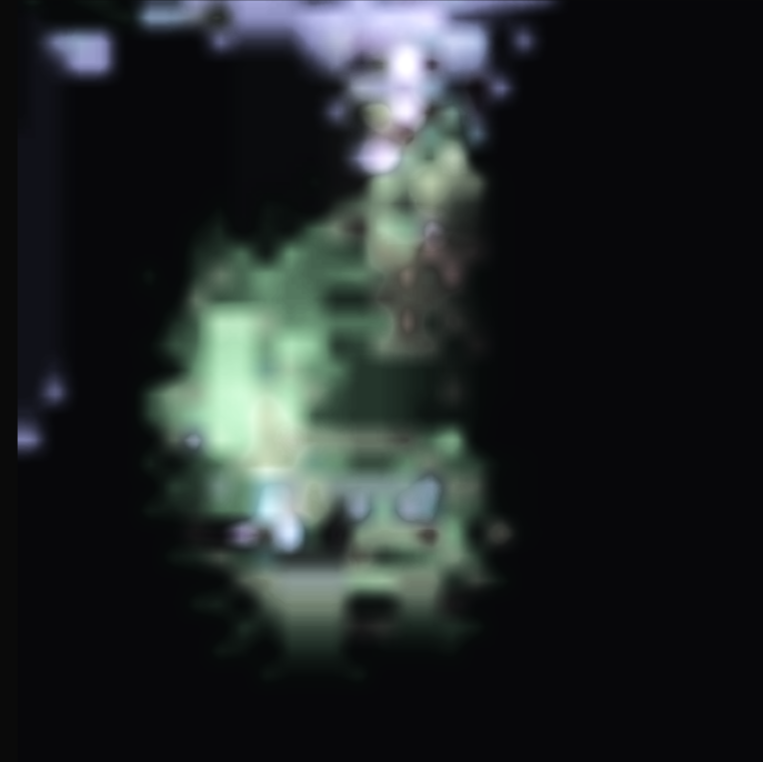
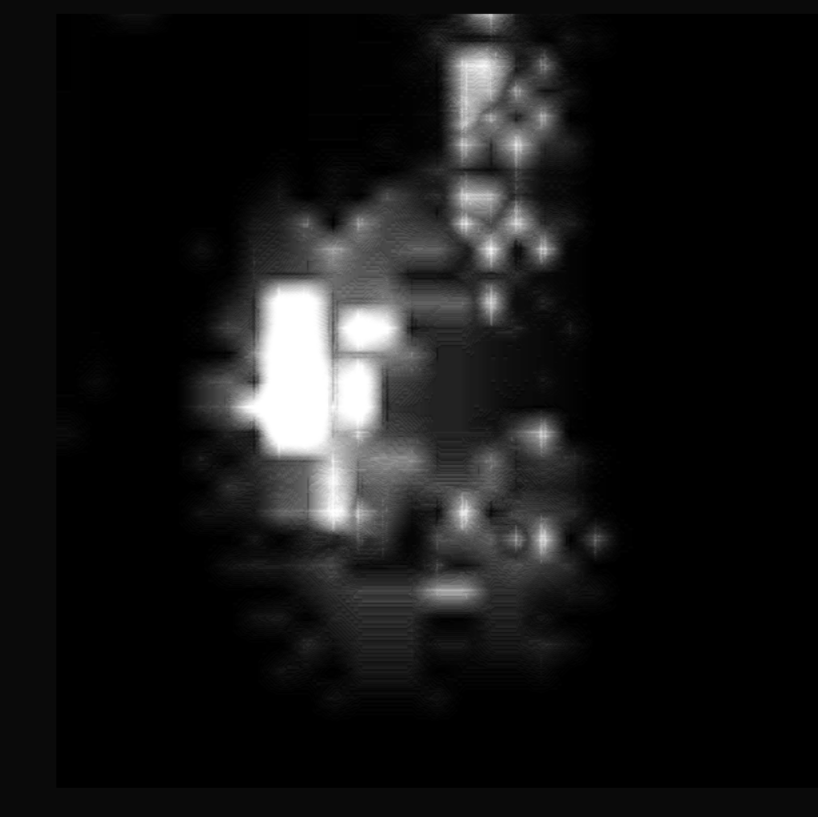
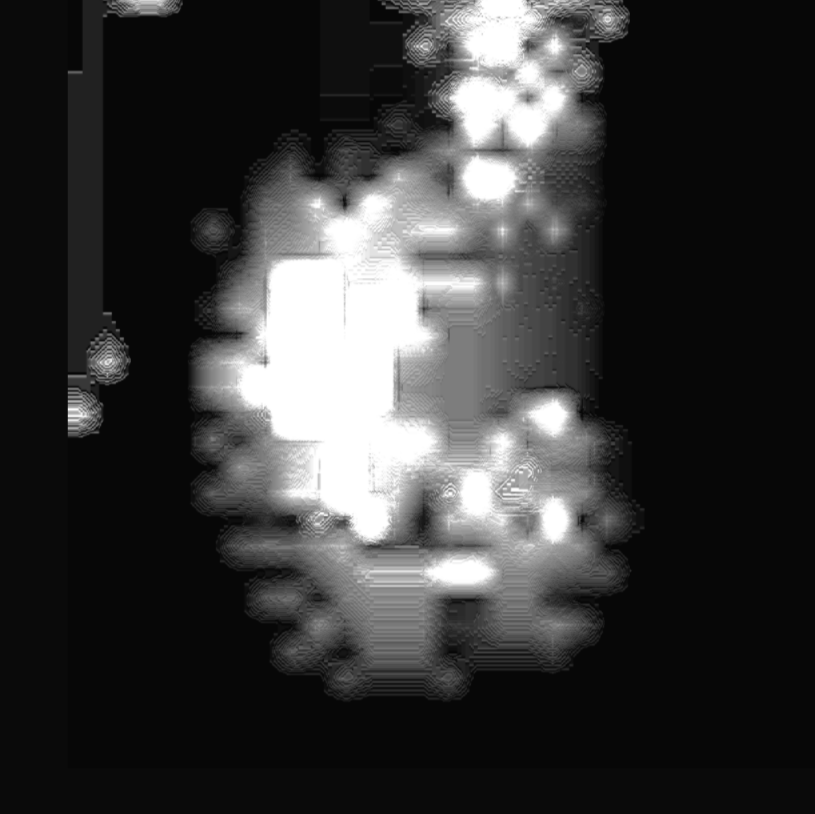
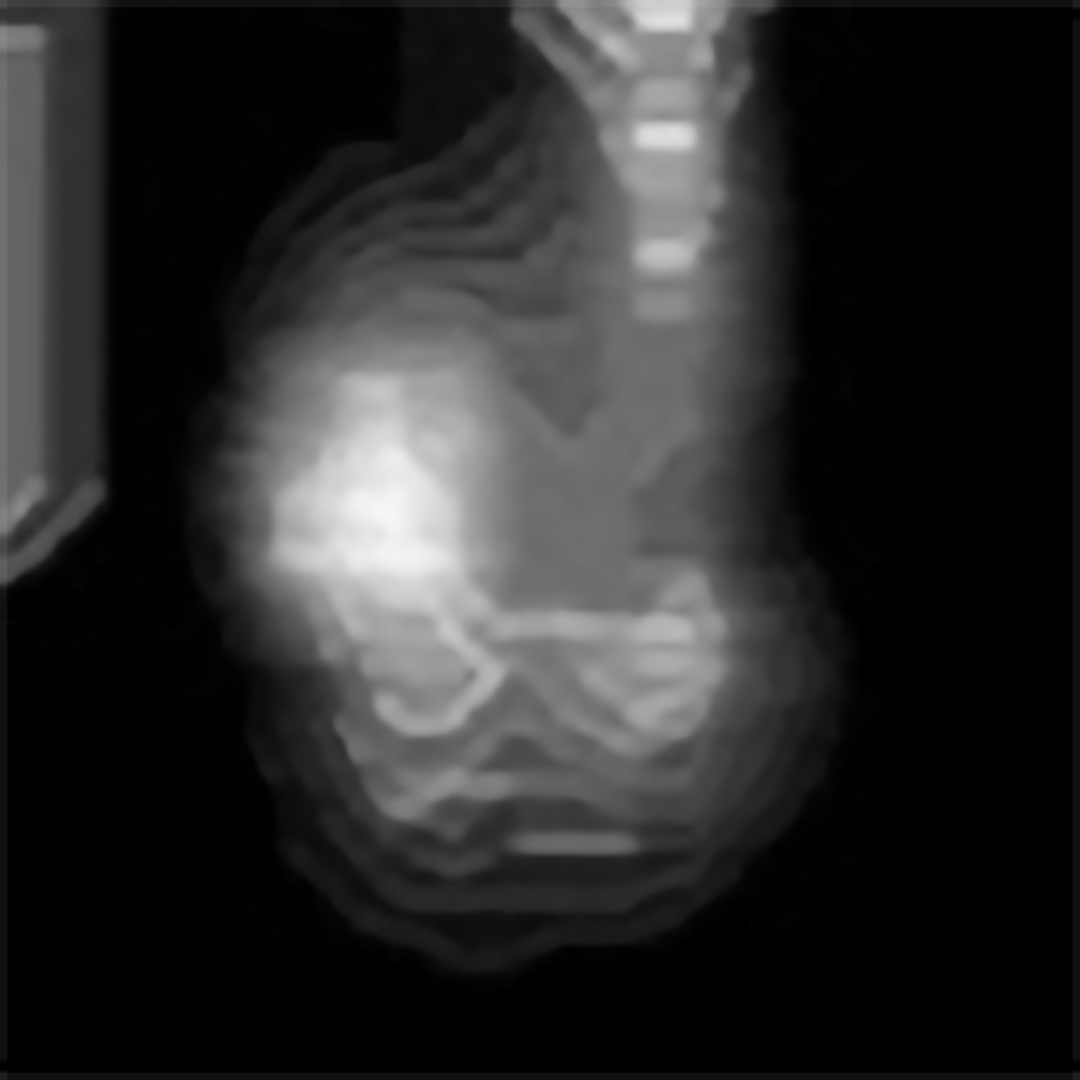
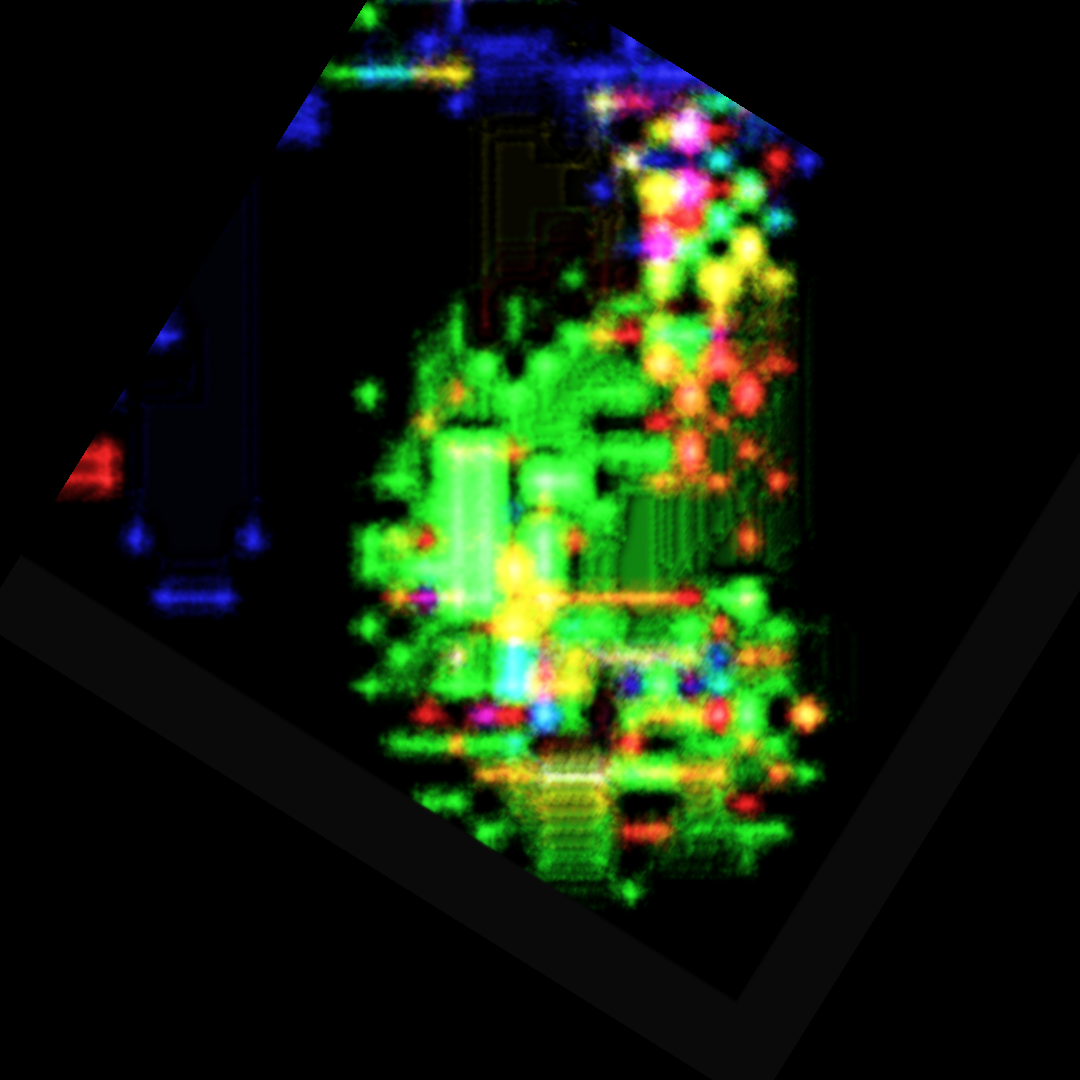
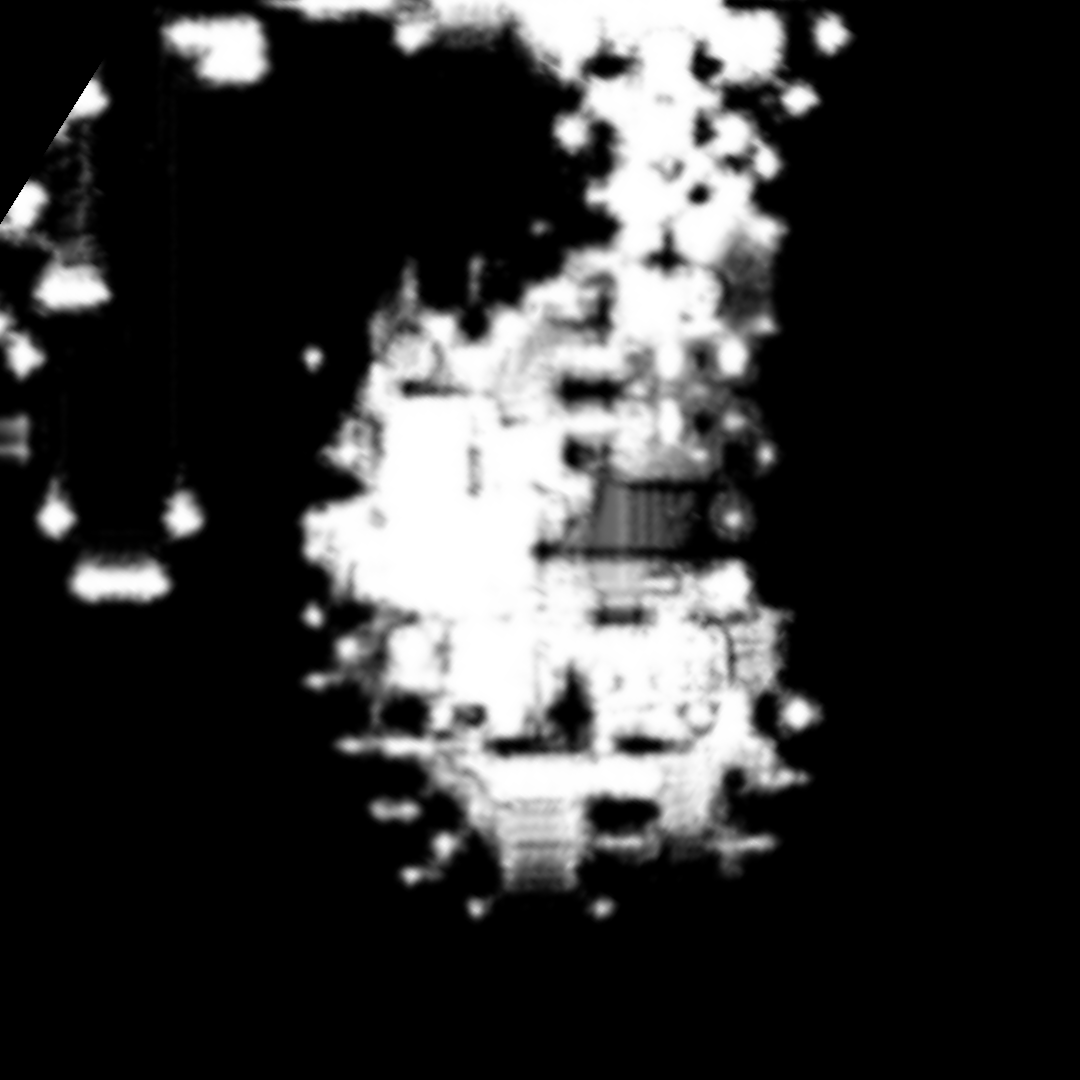
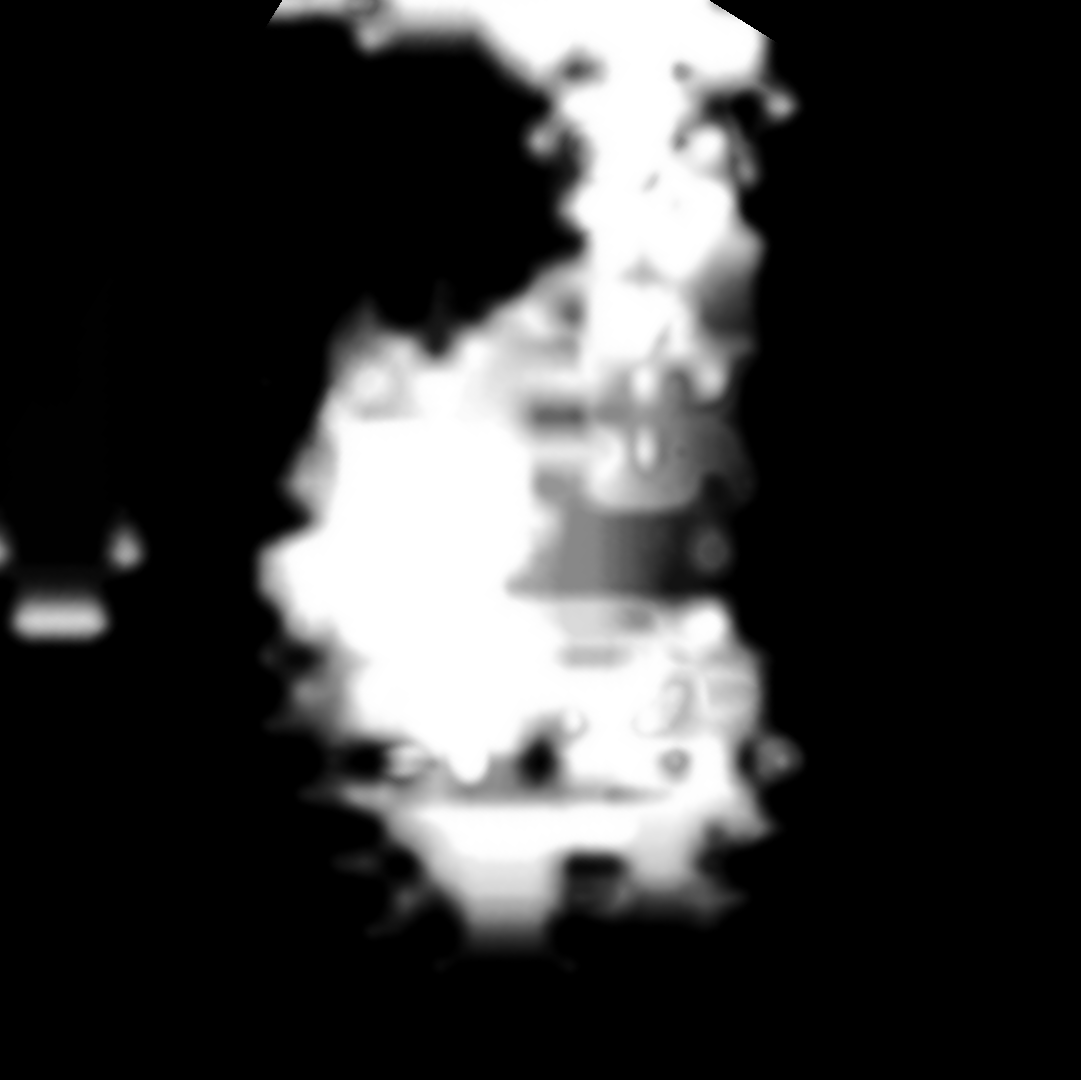
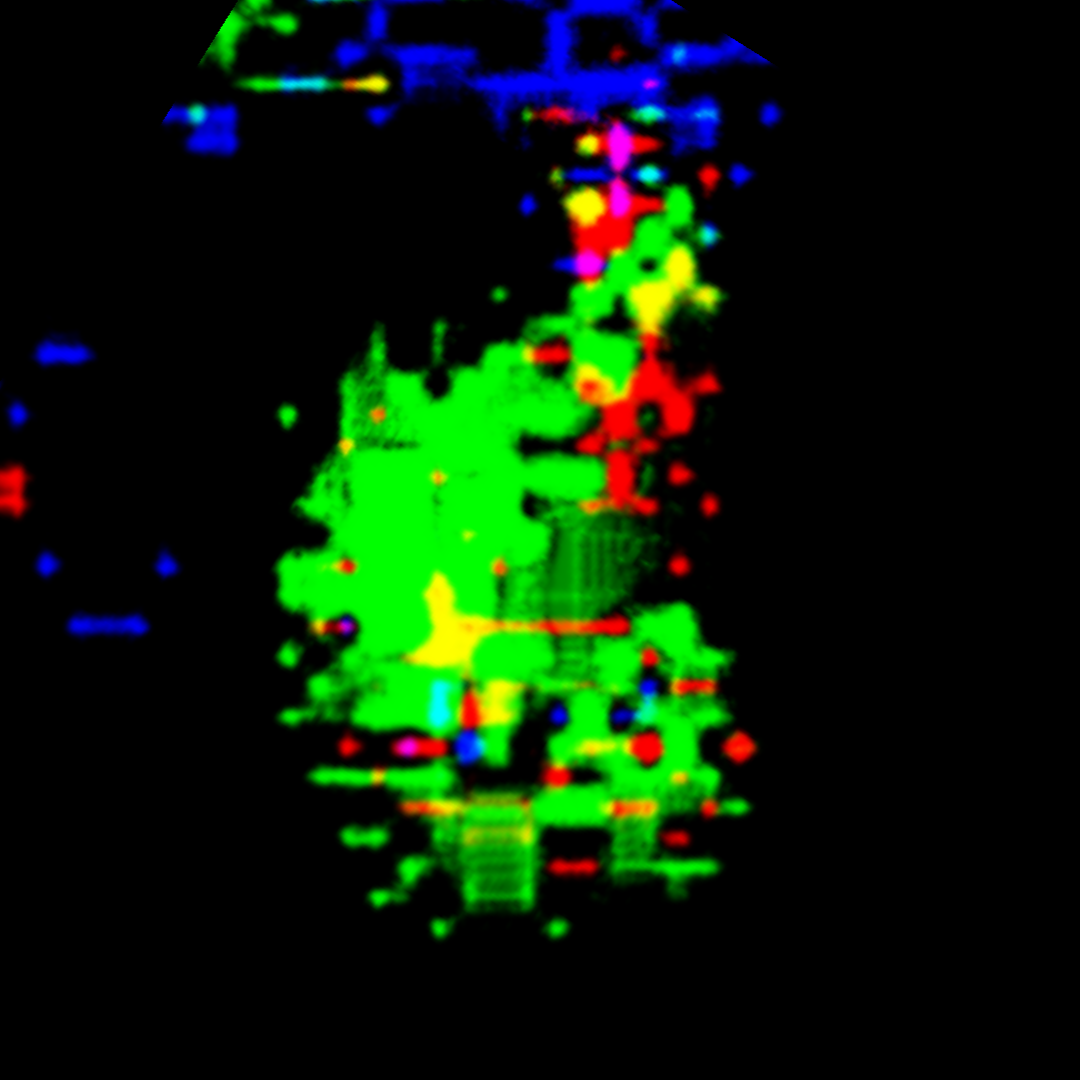
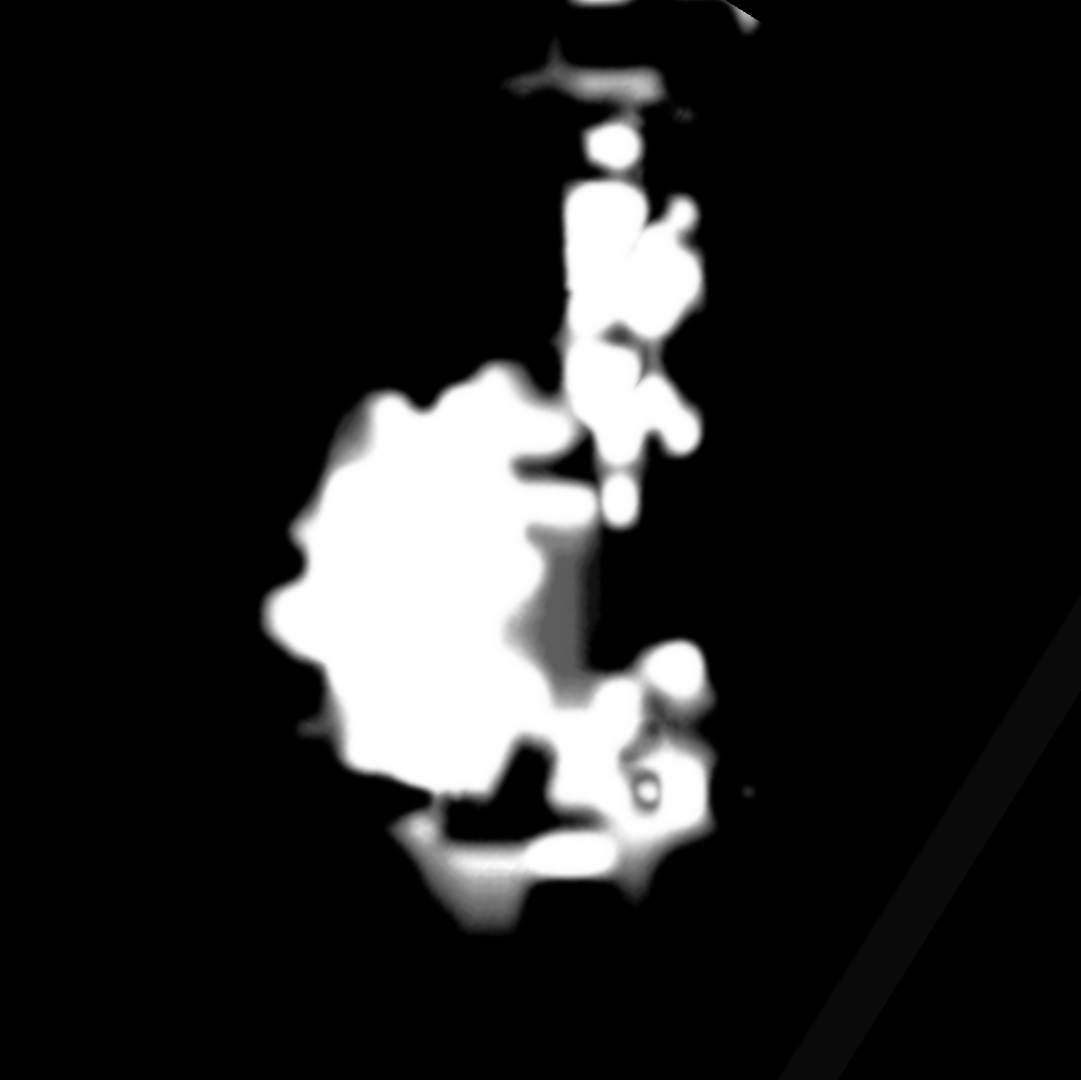
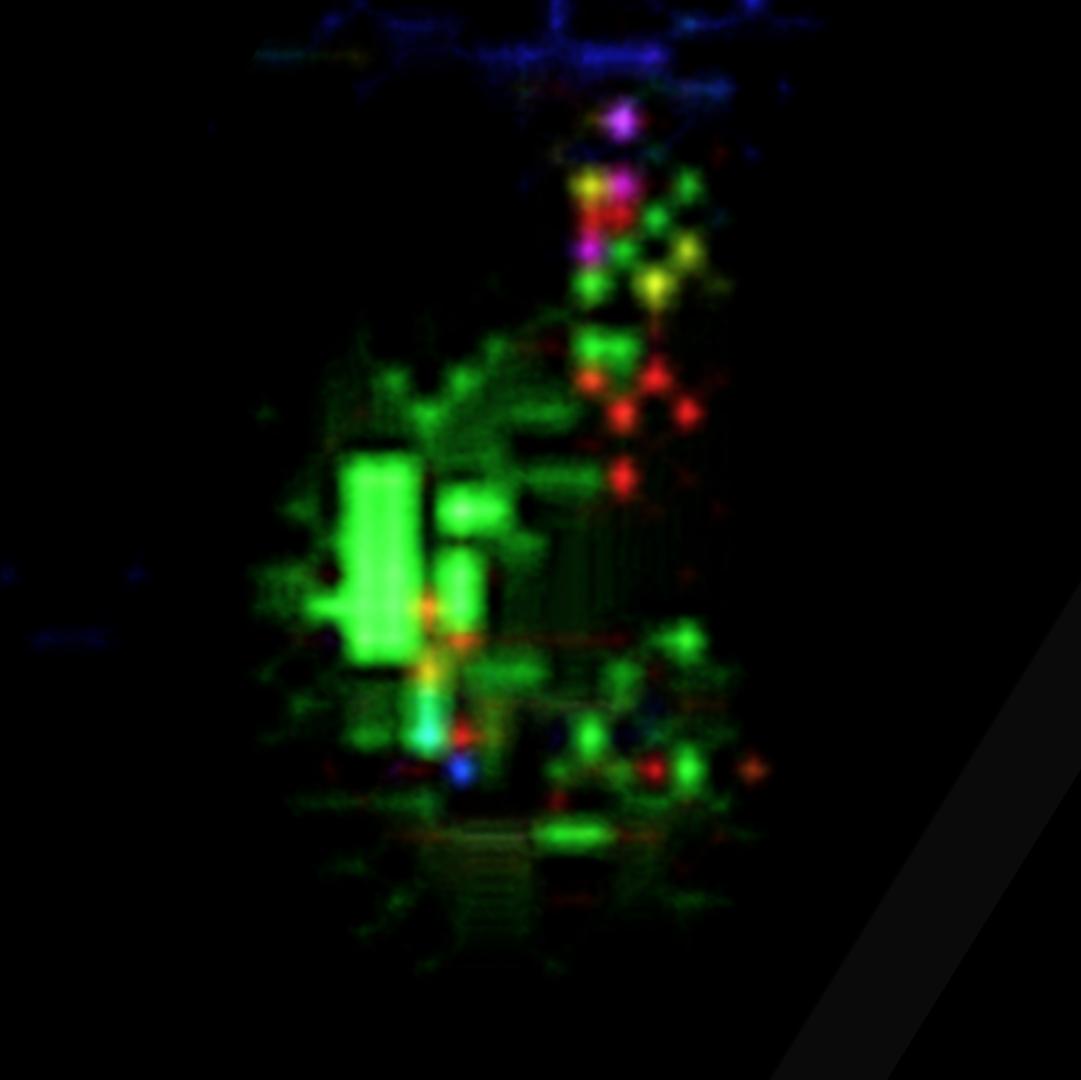
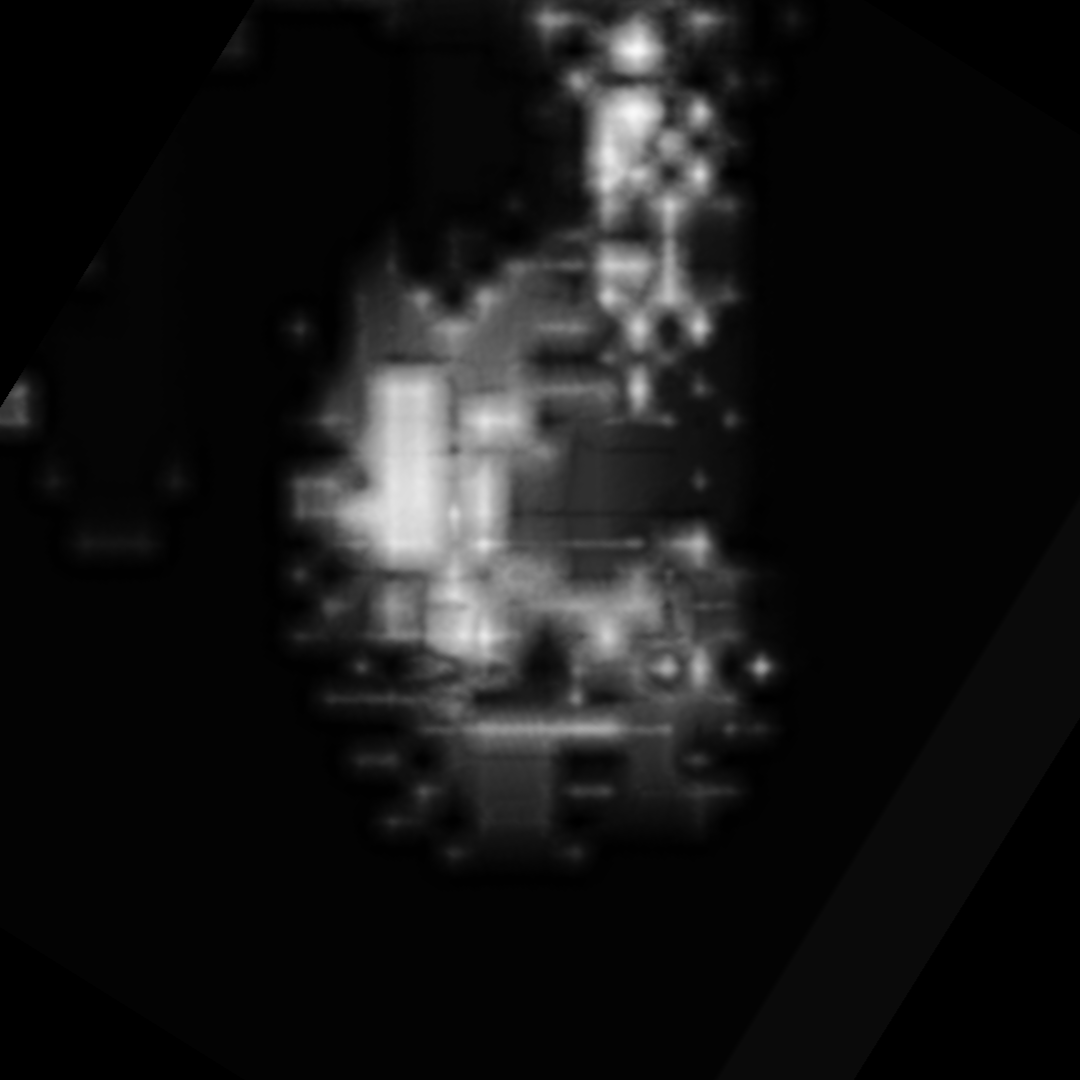
Contextualizing the Energy Supply: The Universal Ritual of Sustenance
The following Gallery 6 integrates the individual technical findings into a comprehensive whole. We are witnessing the Constructed Biological Entity (CBE) in an intimate moment of functional activity: the energy supply or substrate intake process.
The scene depicts the entity in an apparently seated position, compared to the size relationships of other entities within the UAP. The head is slightly raised and turned slightly to the left (ventrolaterally), while its gaze is directed towards the view. A supply element (the tank), which together with the tube and the oral interface forms the supply system, acts as a reservoir for the energetic substrate.
This observation leads to a fundamental realization: The necessity of external energy intake is not a uniquely human trait, but a universal biological and cybernetic constant. We are observing a life-sustaining ritual that bridges the gap between our species and these species of Non-human Intelligences (NHI) — the fundamental dependence on energy to maintain existence.
Gallery 6: Visualization Concept: The Dual View
To illustrate the interaction of the supply system with the anatomy of the entity, the following Figures 3.39 to 3.48 are shown as a portrait (left image) and a detailed view (right image):
- The Portrait: The complete view of the CBE face. It allows for the observation of the entire physiology and the calm, focused posture during the procedure.
- The Detailed View: A targeted magnification focusing on the mechanical interface. Here, the materiality of the tube (area B) and the dynamics of the fluid phase ( area C) become apparent within their functional context.
- Regarding Figure 3.40 (see also Fig. 3.31, Gallery 5): Morphological relationship between the tube outlet (B) and the fluid (C): This comparison (left: overall view of the ROI; right: enlarged crop) visualizes, through the applied configuration parameters (see figure caption for Fig. 3.31), the structural integrity of the tube (area B) and the fluid (area C) within the image space. The distinct materiality of the tube and fluid is evident: the characteristic materiality of the tube, already identified in Figure 3.21, can be clearly differentiated from the transparently visible fluid. This visualization allows for a precise localization of the tube end due to its structural distinctness: the outlet is located at the level of the upper lip, whereas in some of the image series in Galleries 5 and 6—due to artifacts—it appears to be located between the upper and lower lip. Despite the occurring image artifacts (blocky contours), the core morphology and the spatial relationship between the tube and the liquid medium can be derived unambiguously: The tube discharges the fluid directly at the exit opening (Tube outlet), which represents the interface of both elements of the supply system. Due to the previously hypothesized nozzle function of the tube (cf. Fig. 3.23), the fluid reaches the oral interface in a broad-jet pattern.
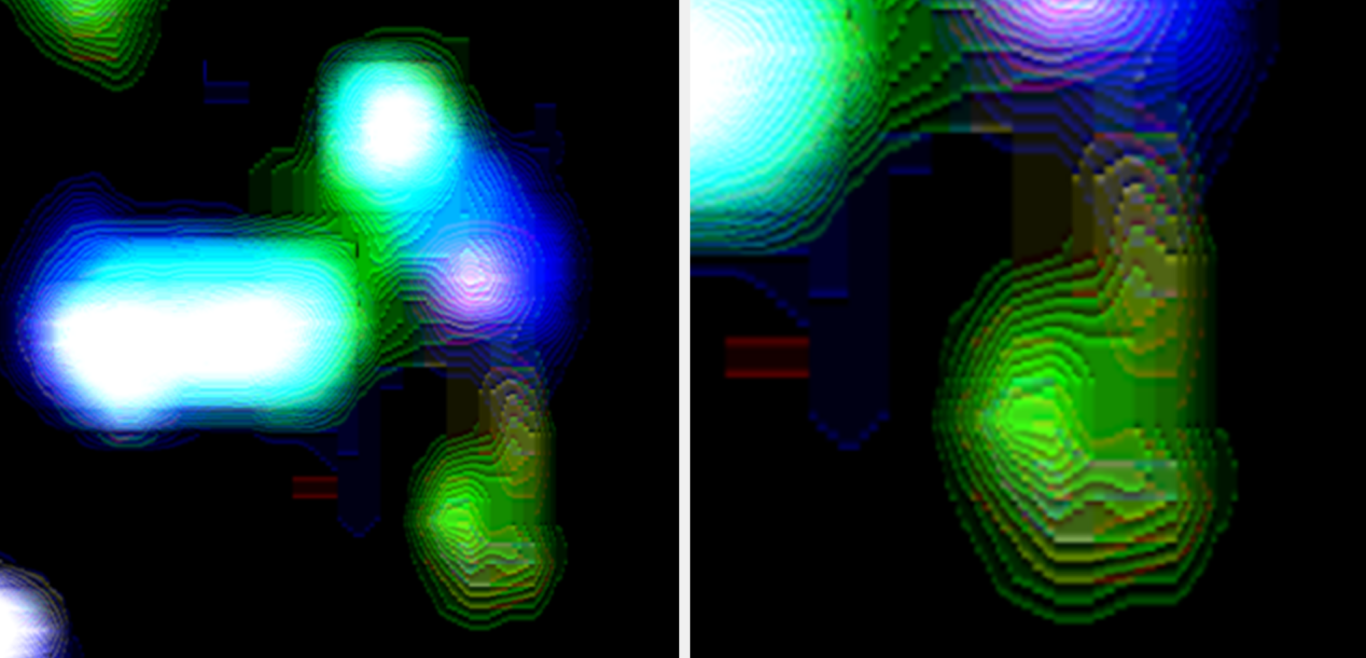
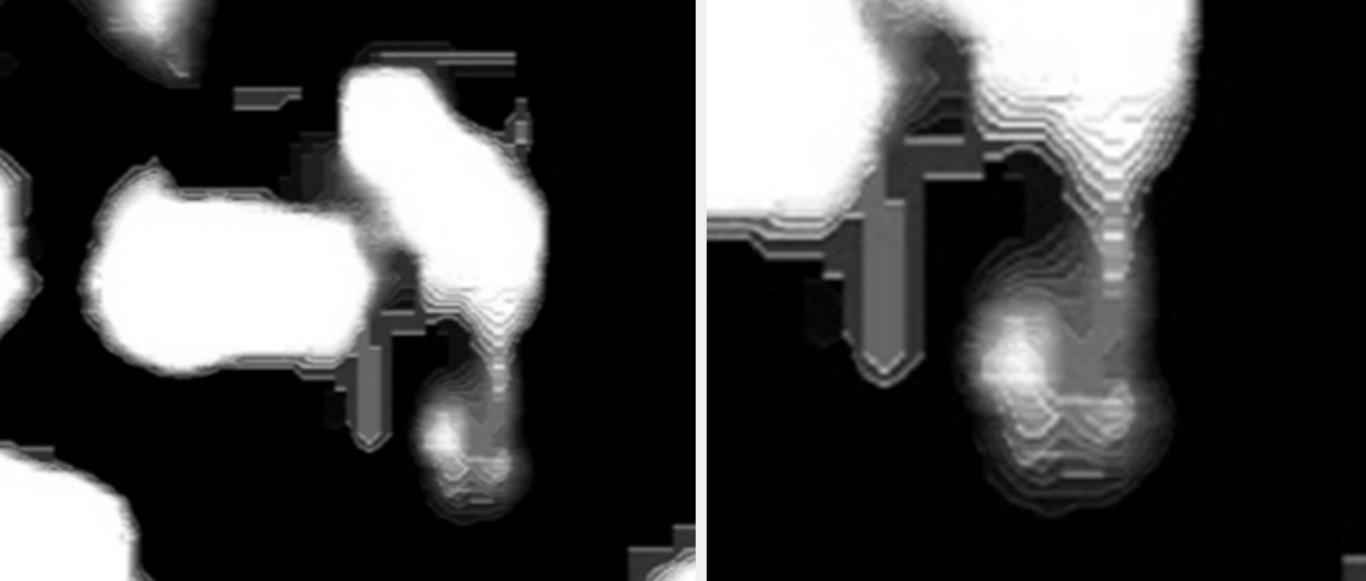

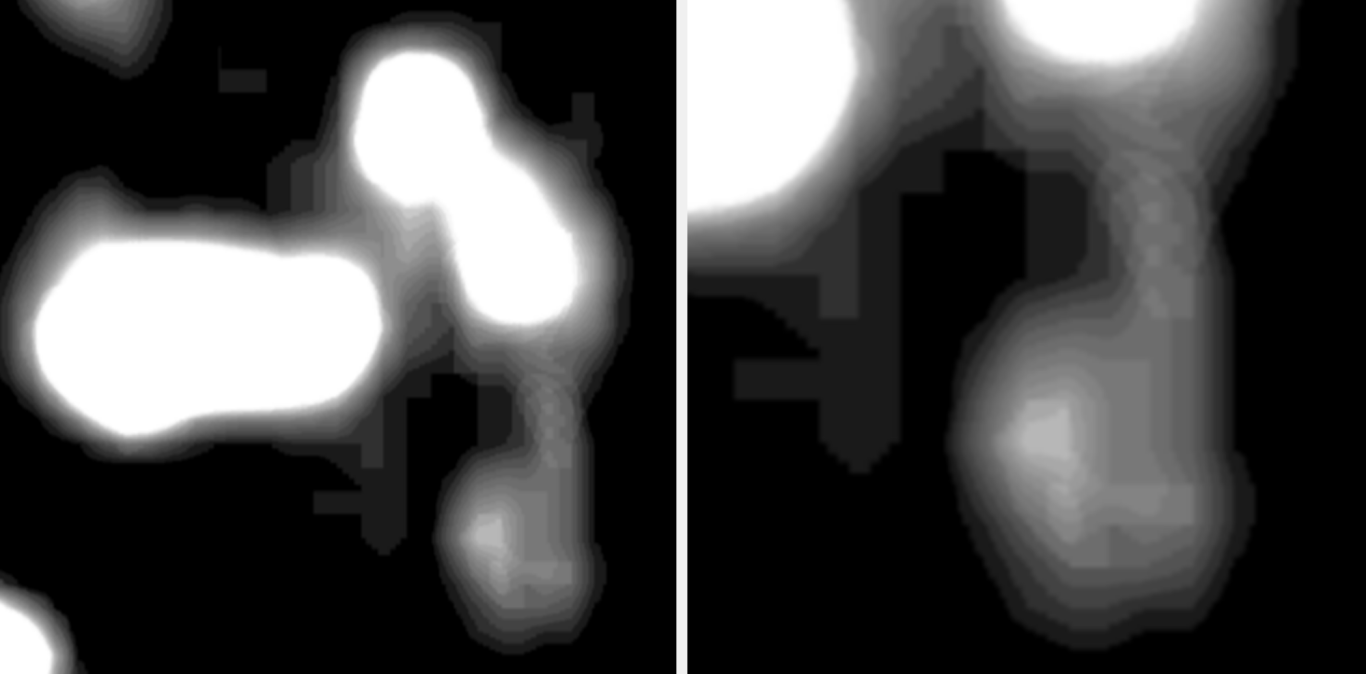
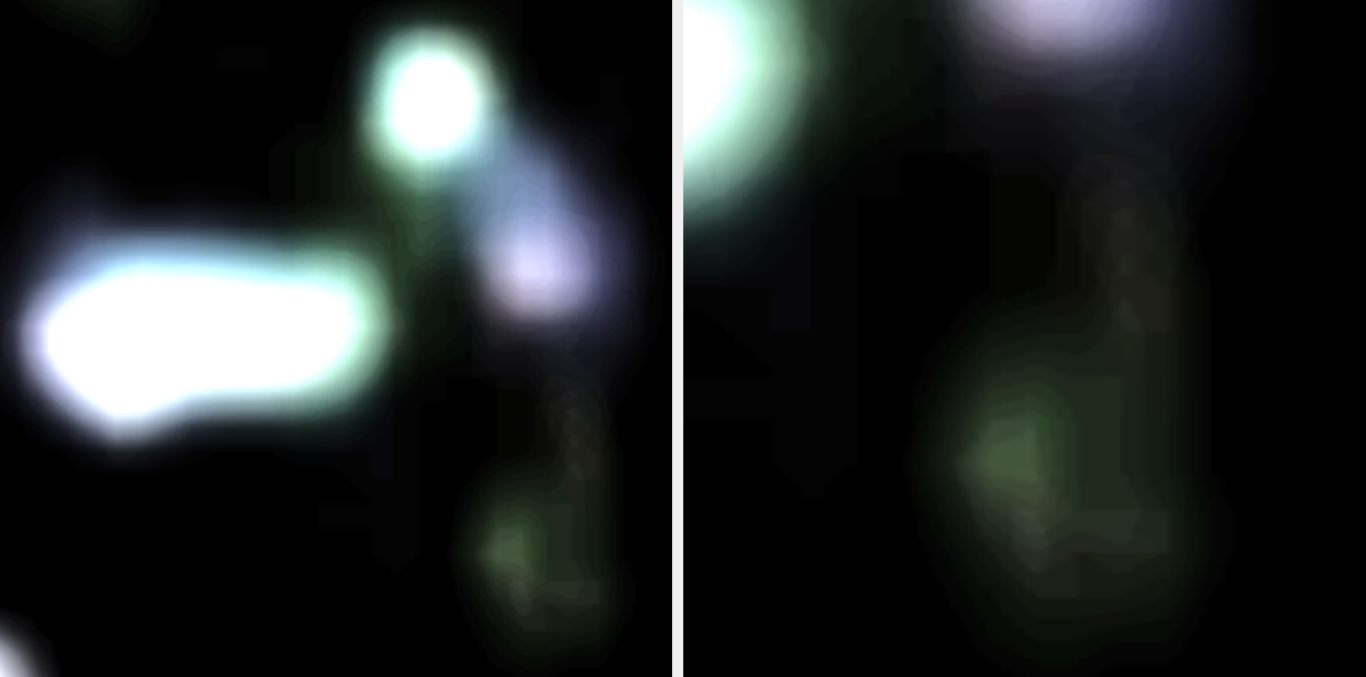
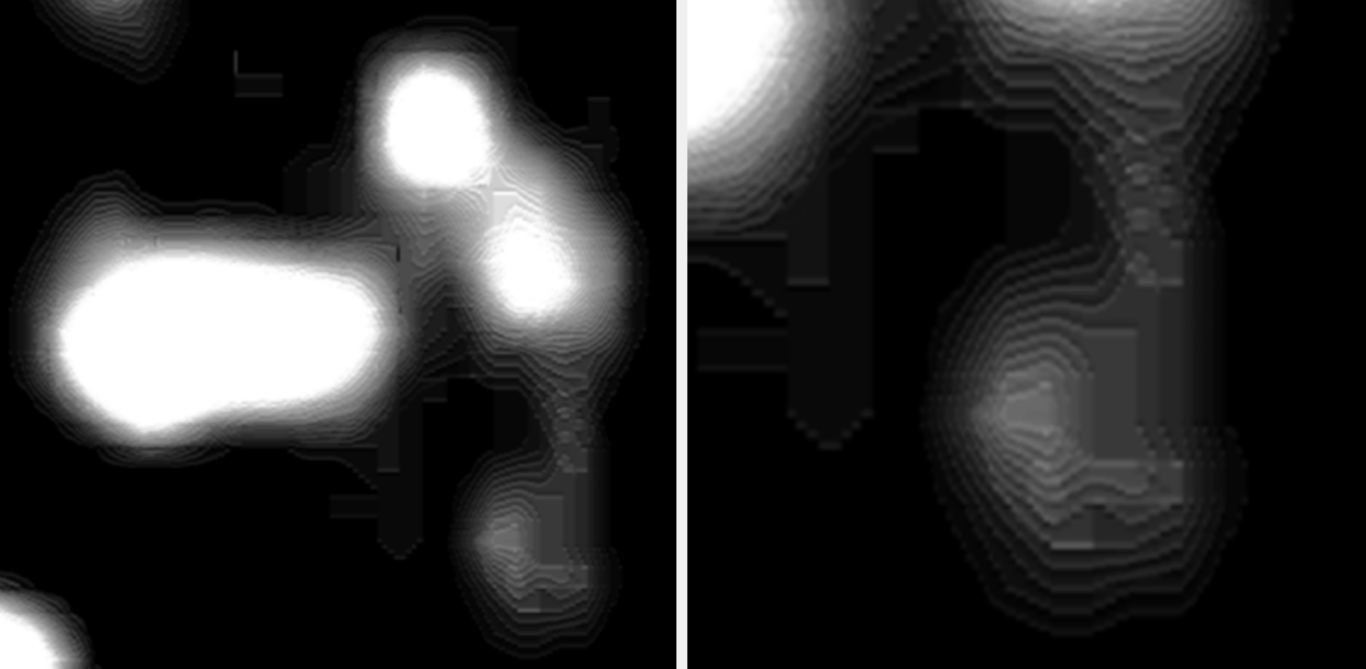
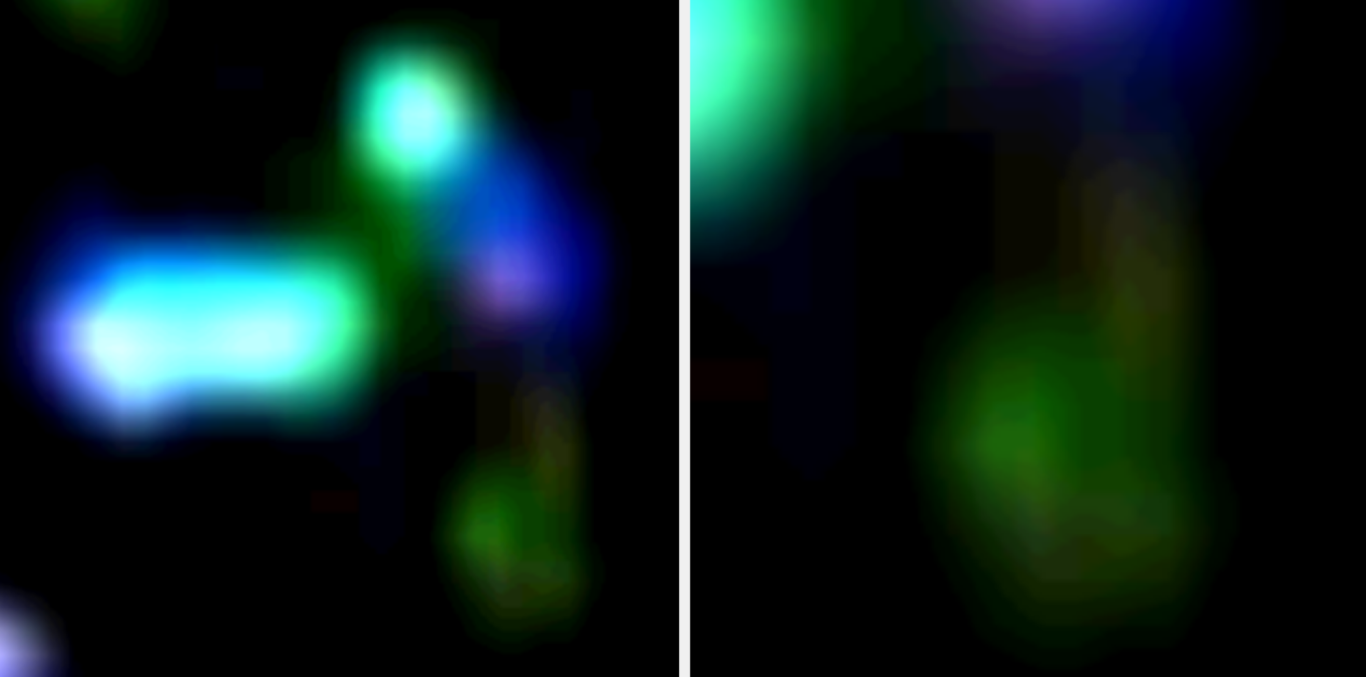
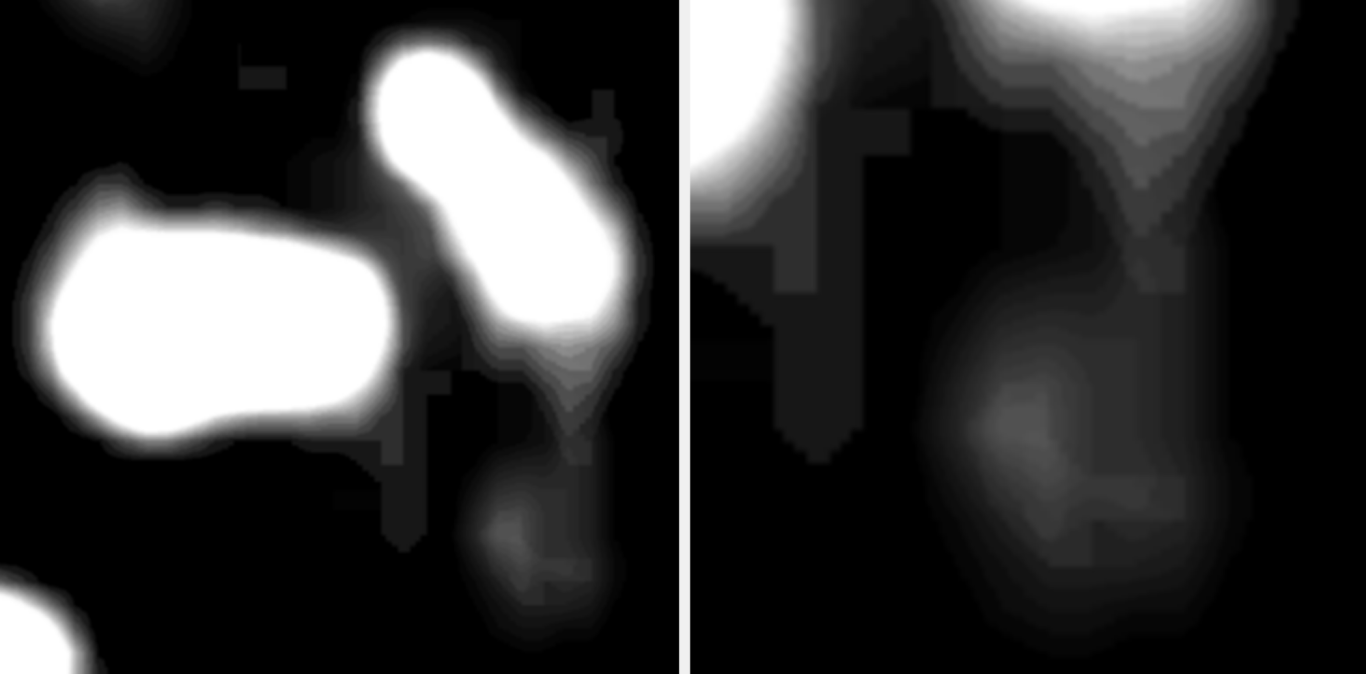
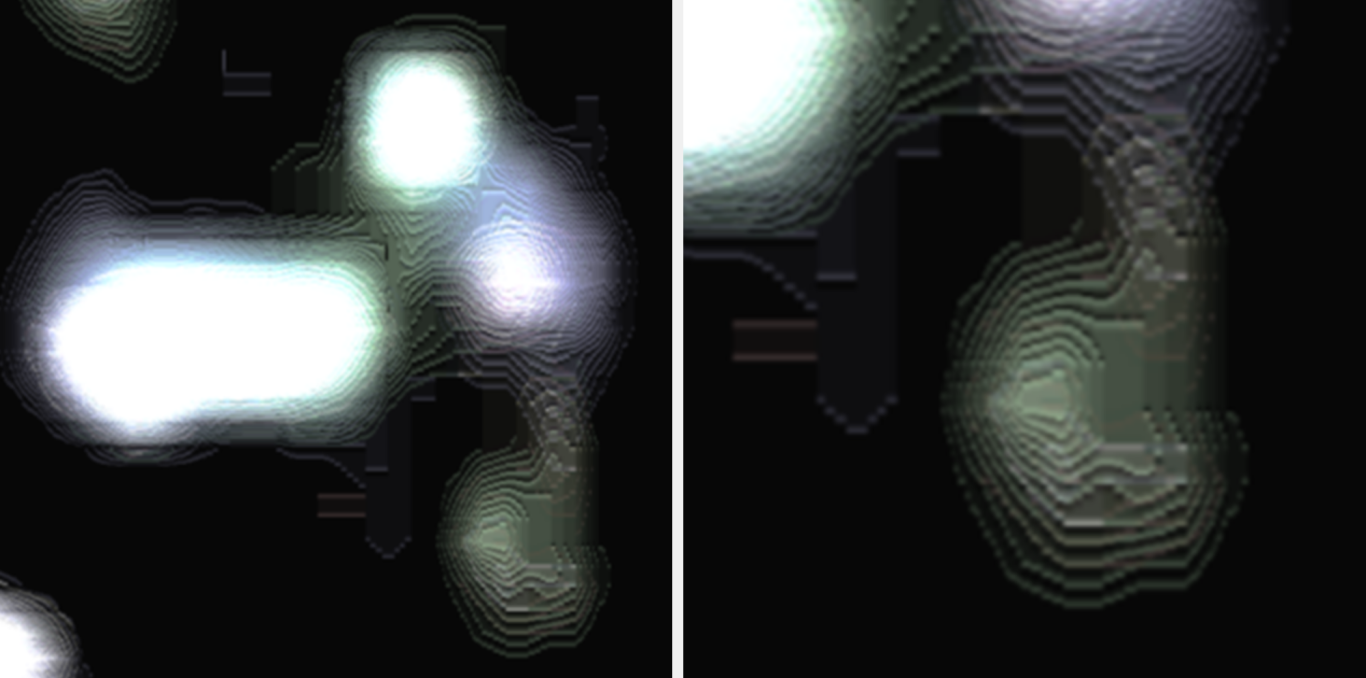
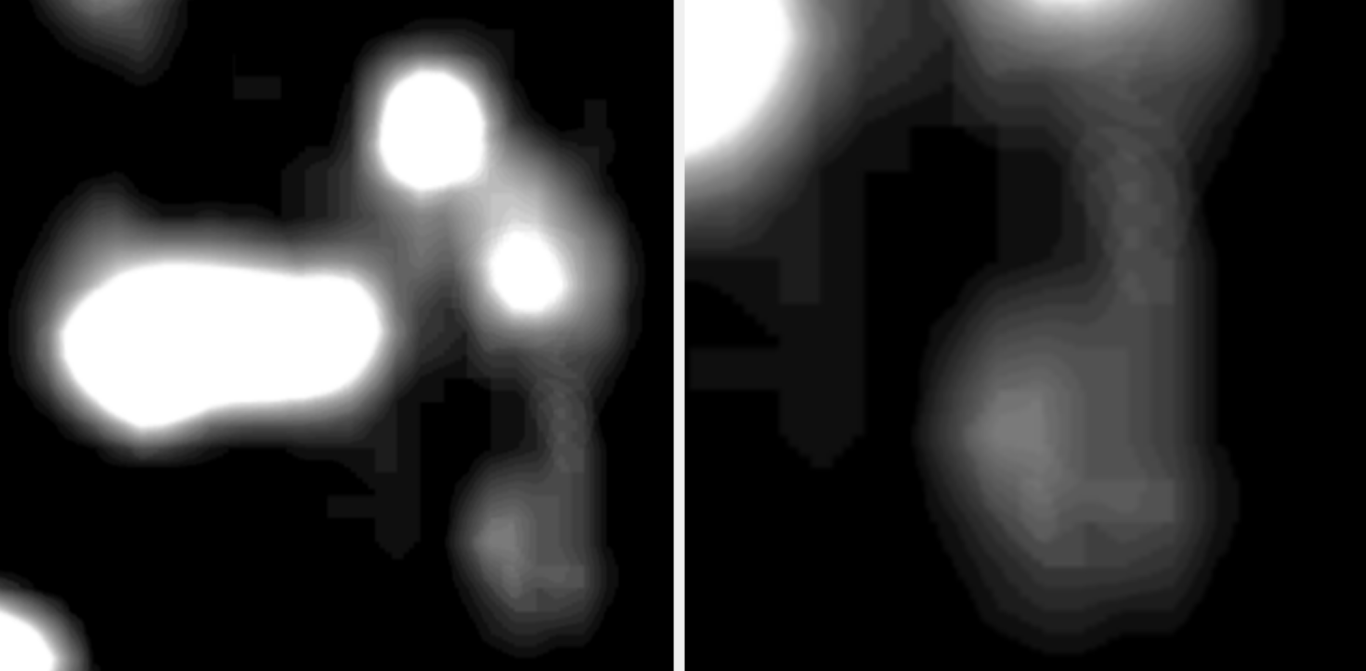
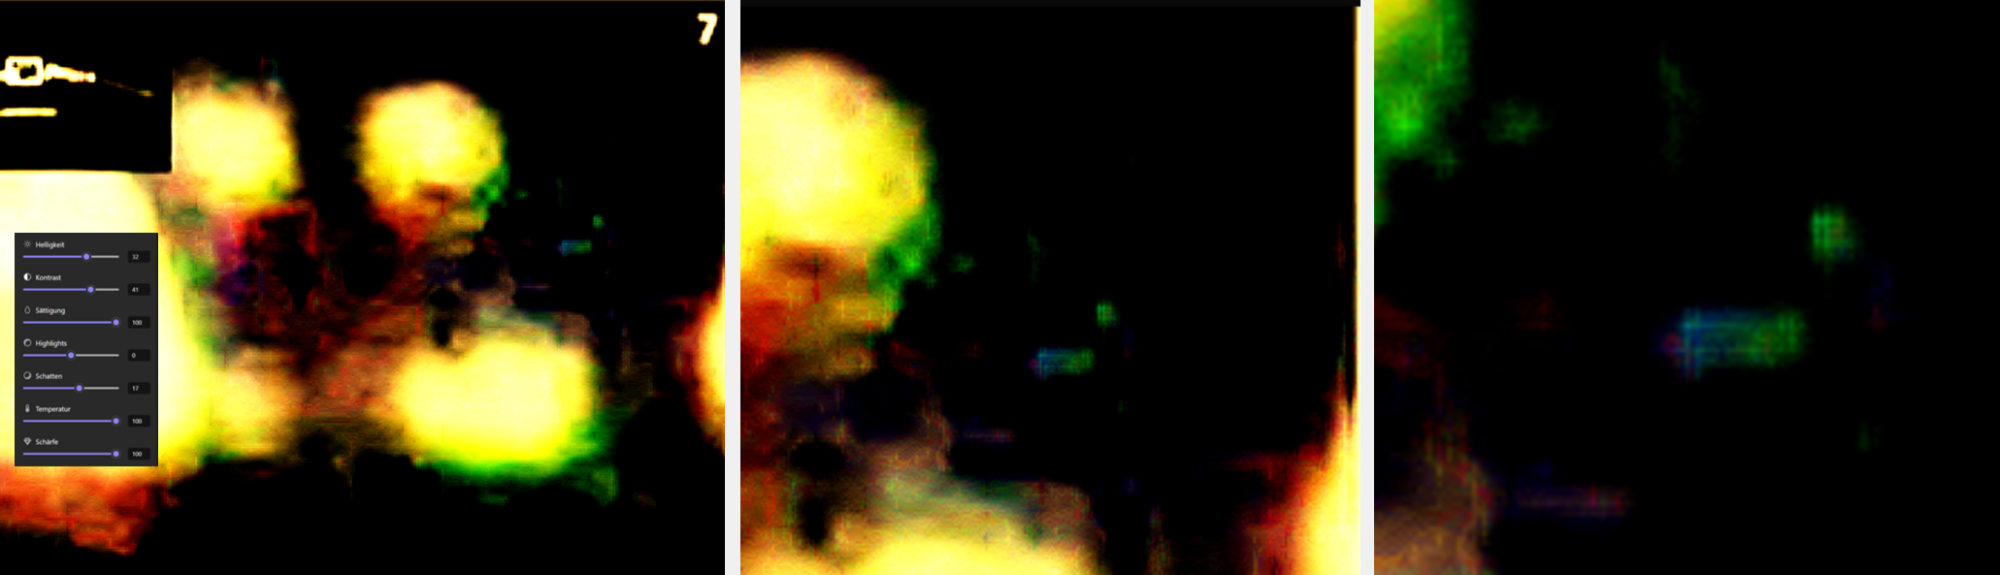
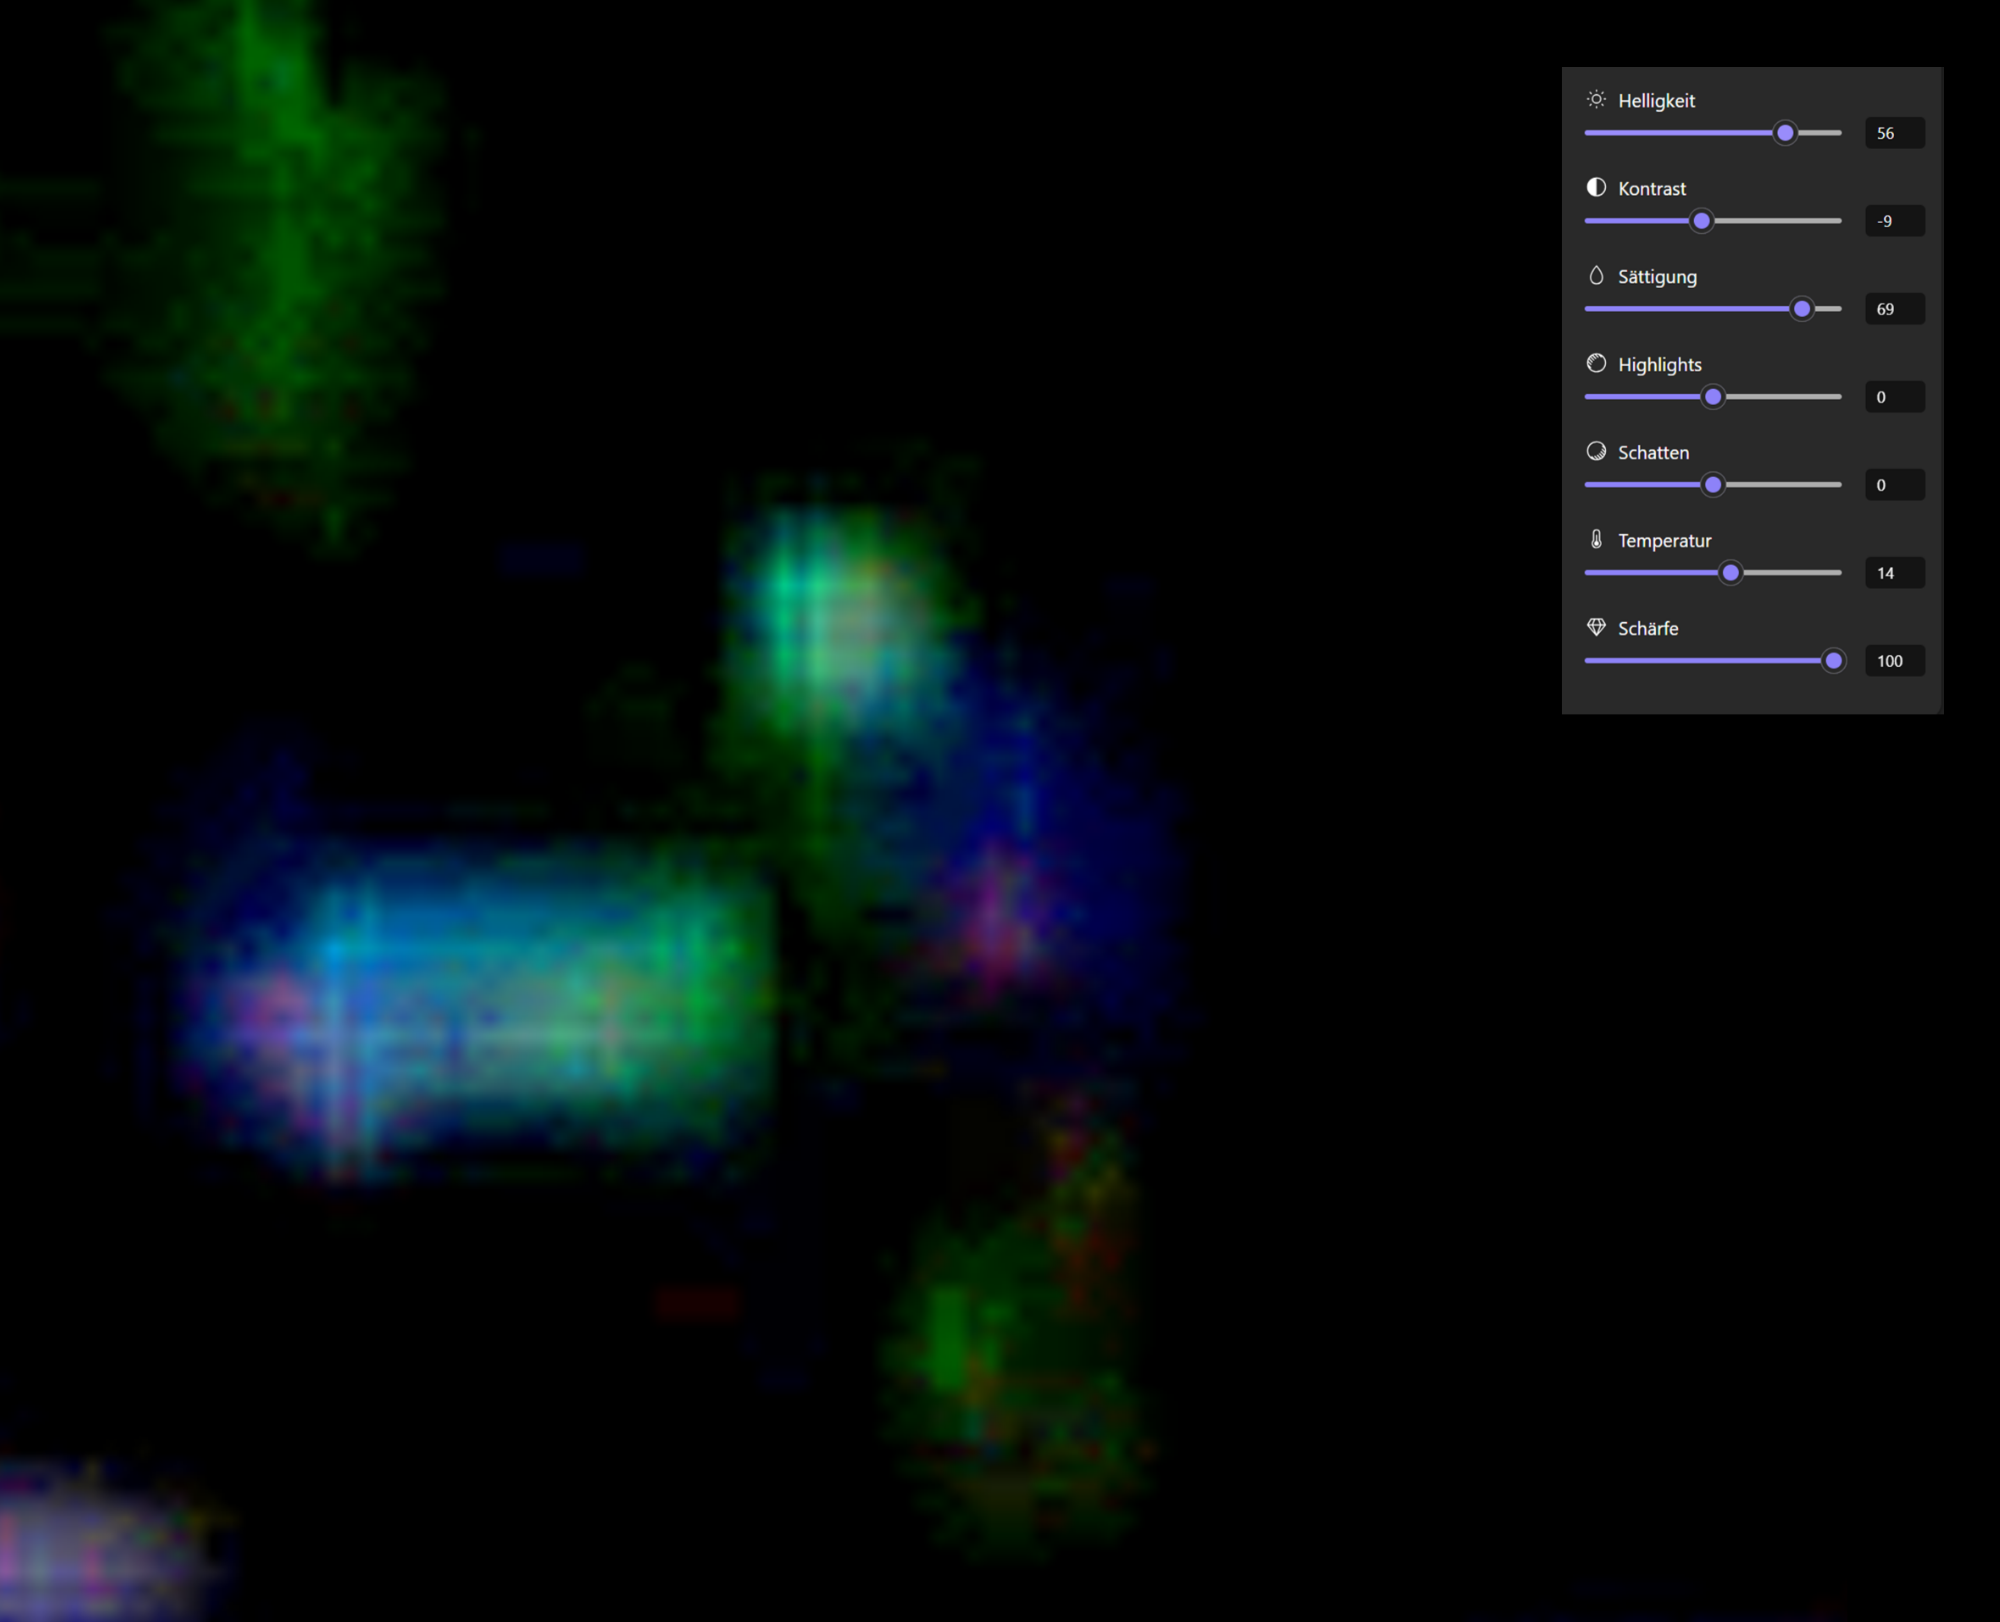
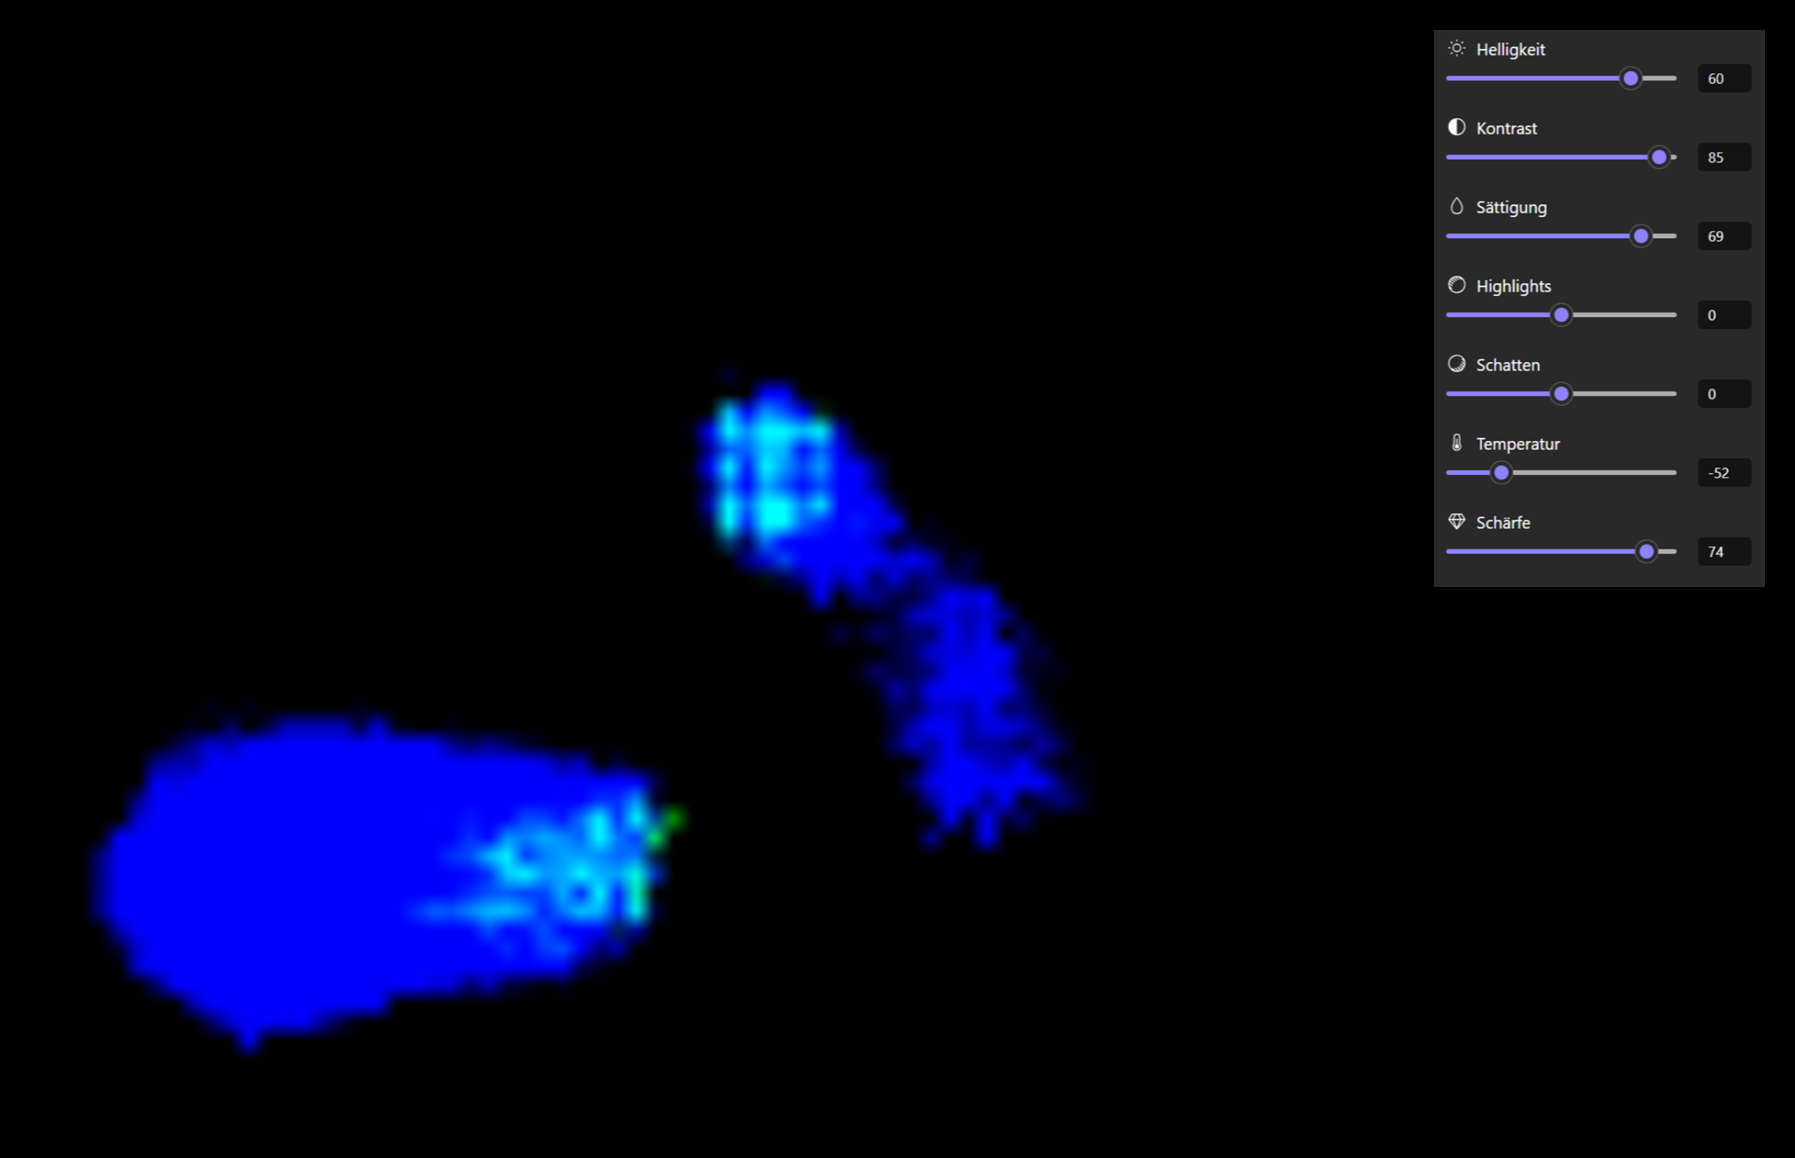
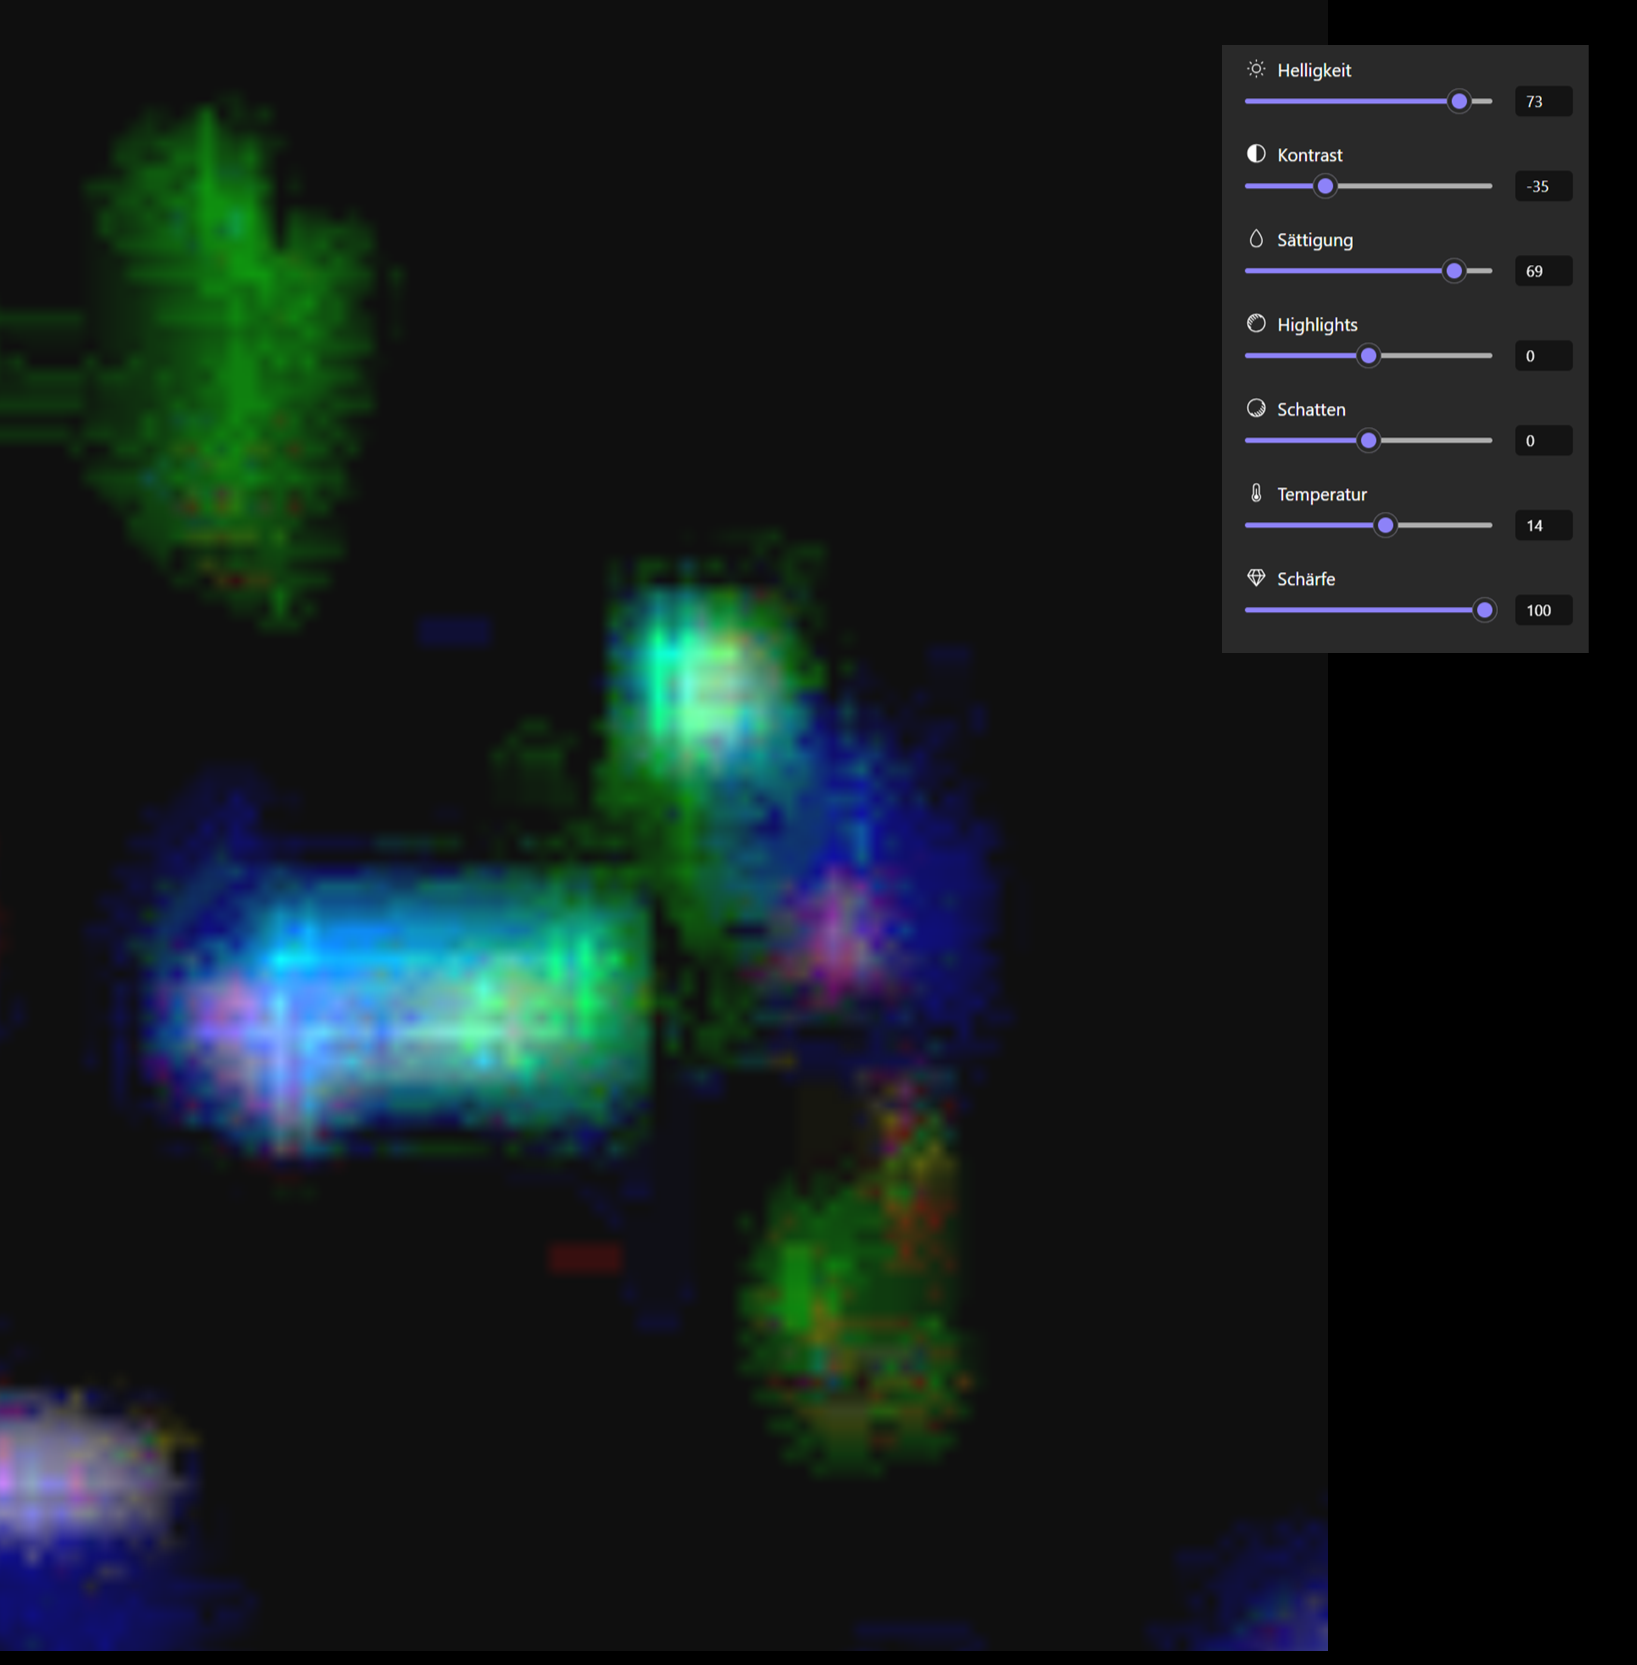
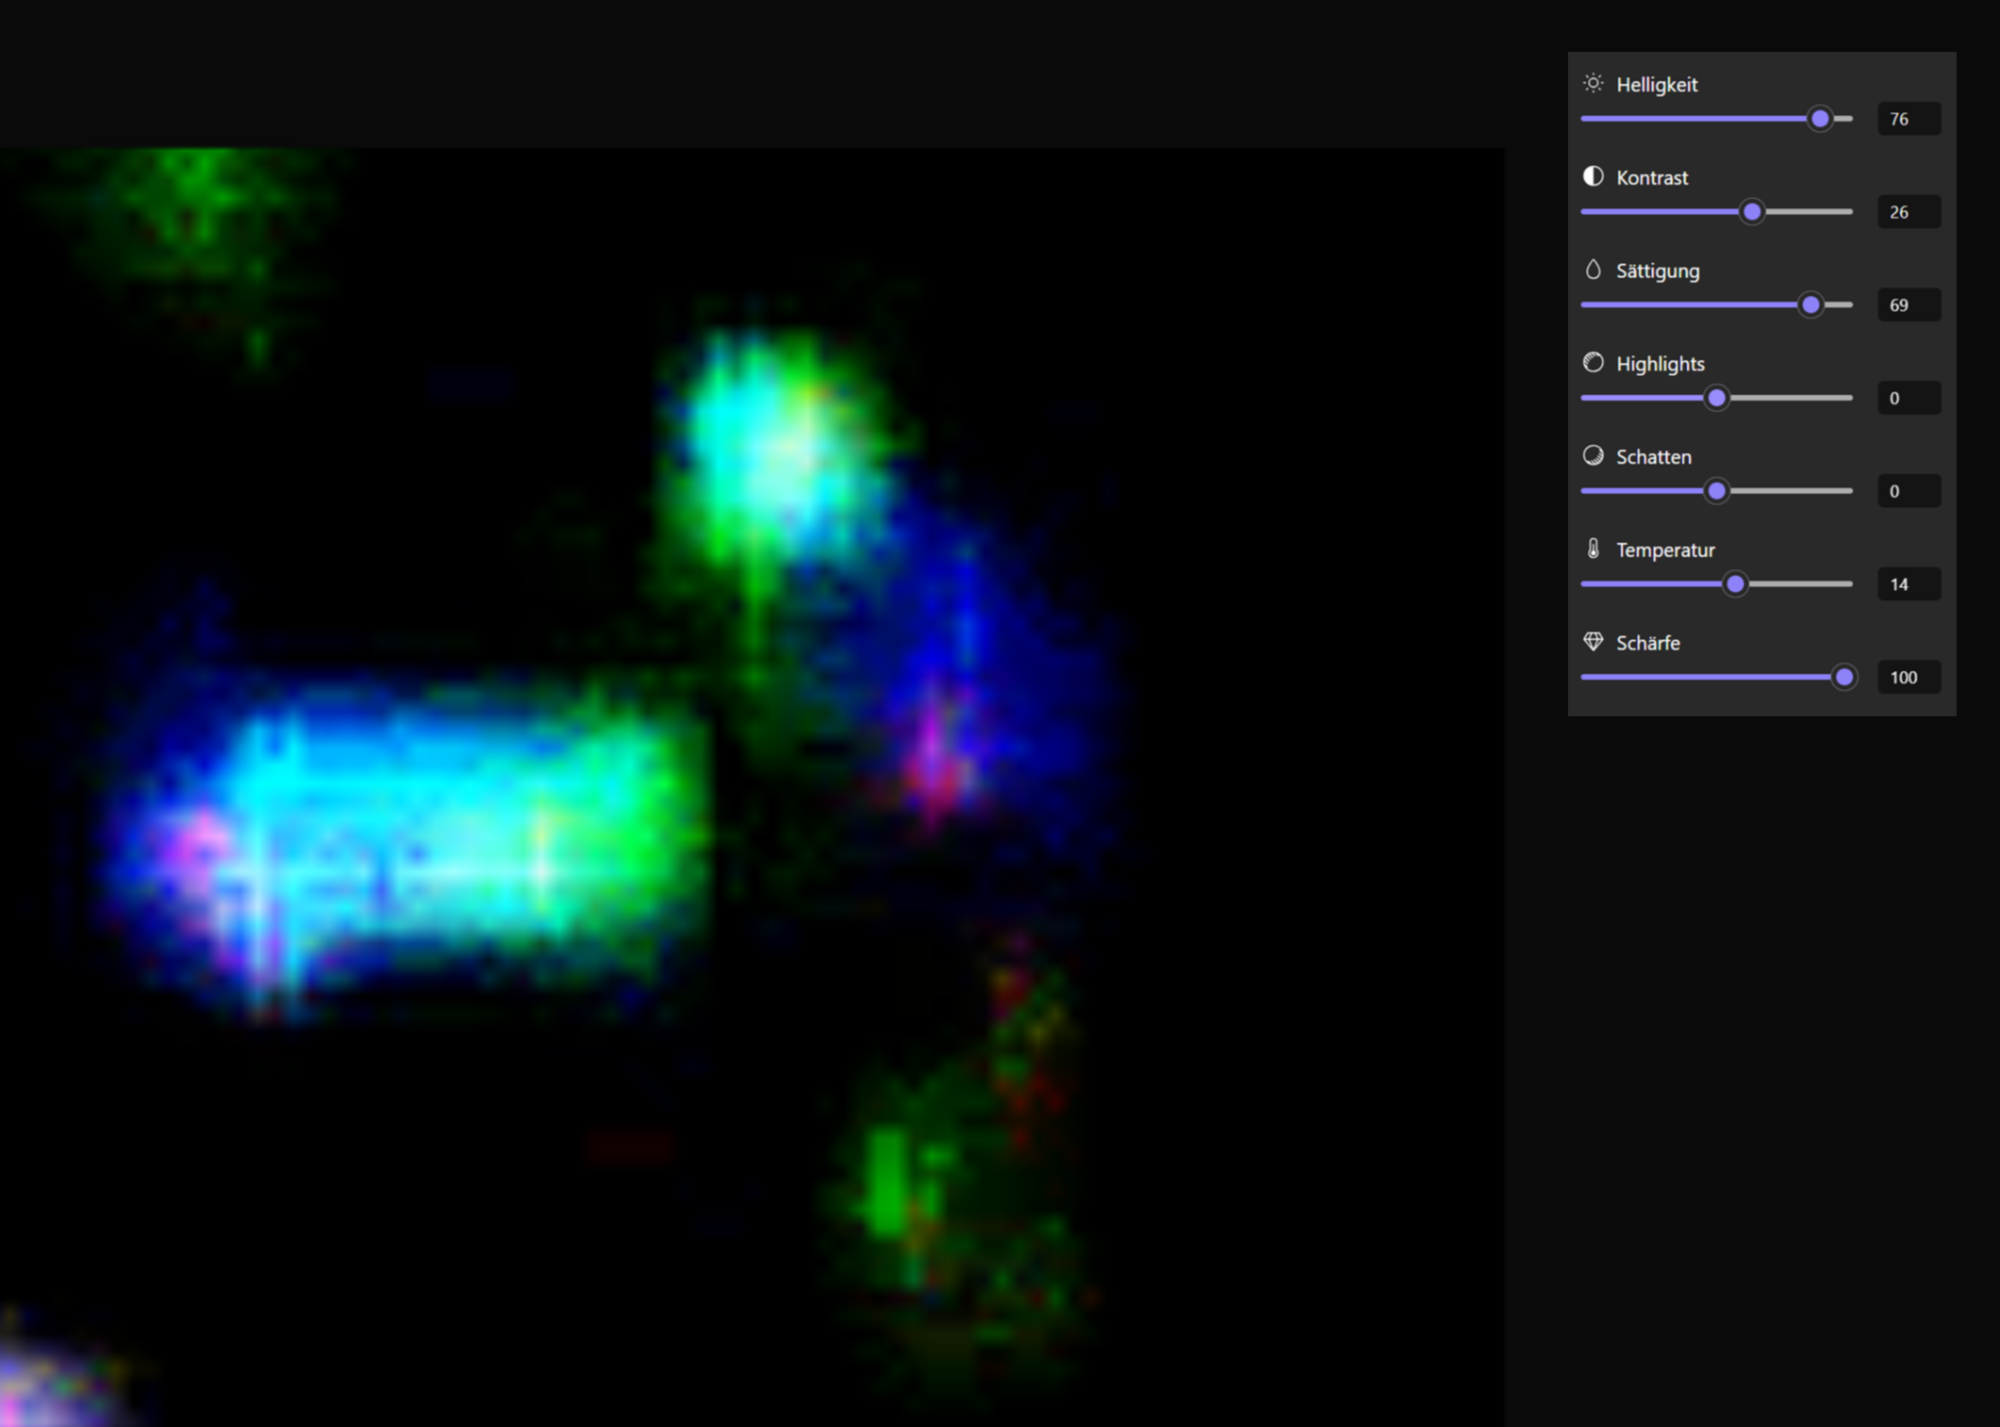
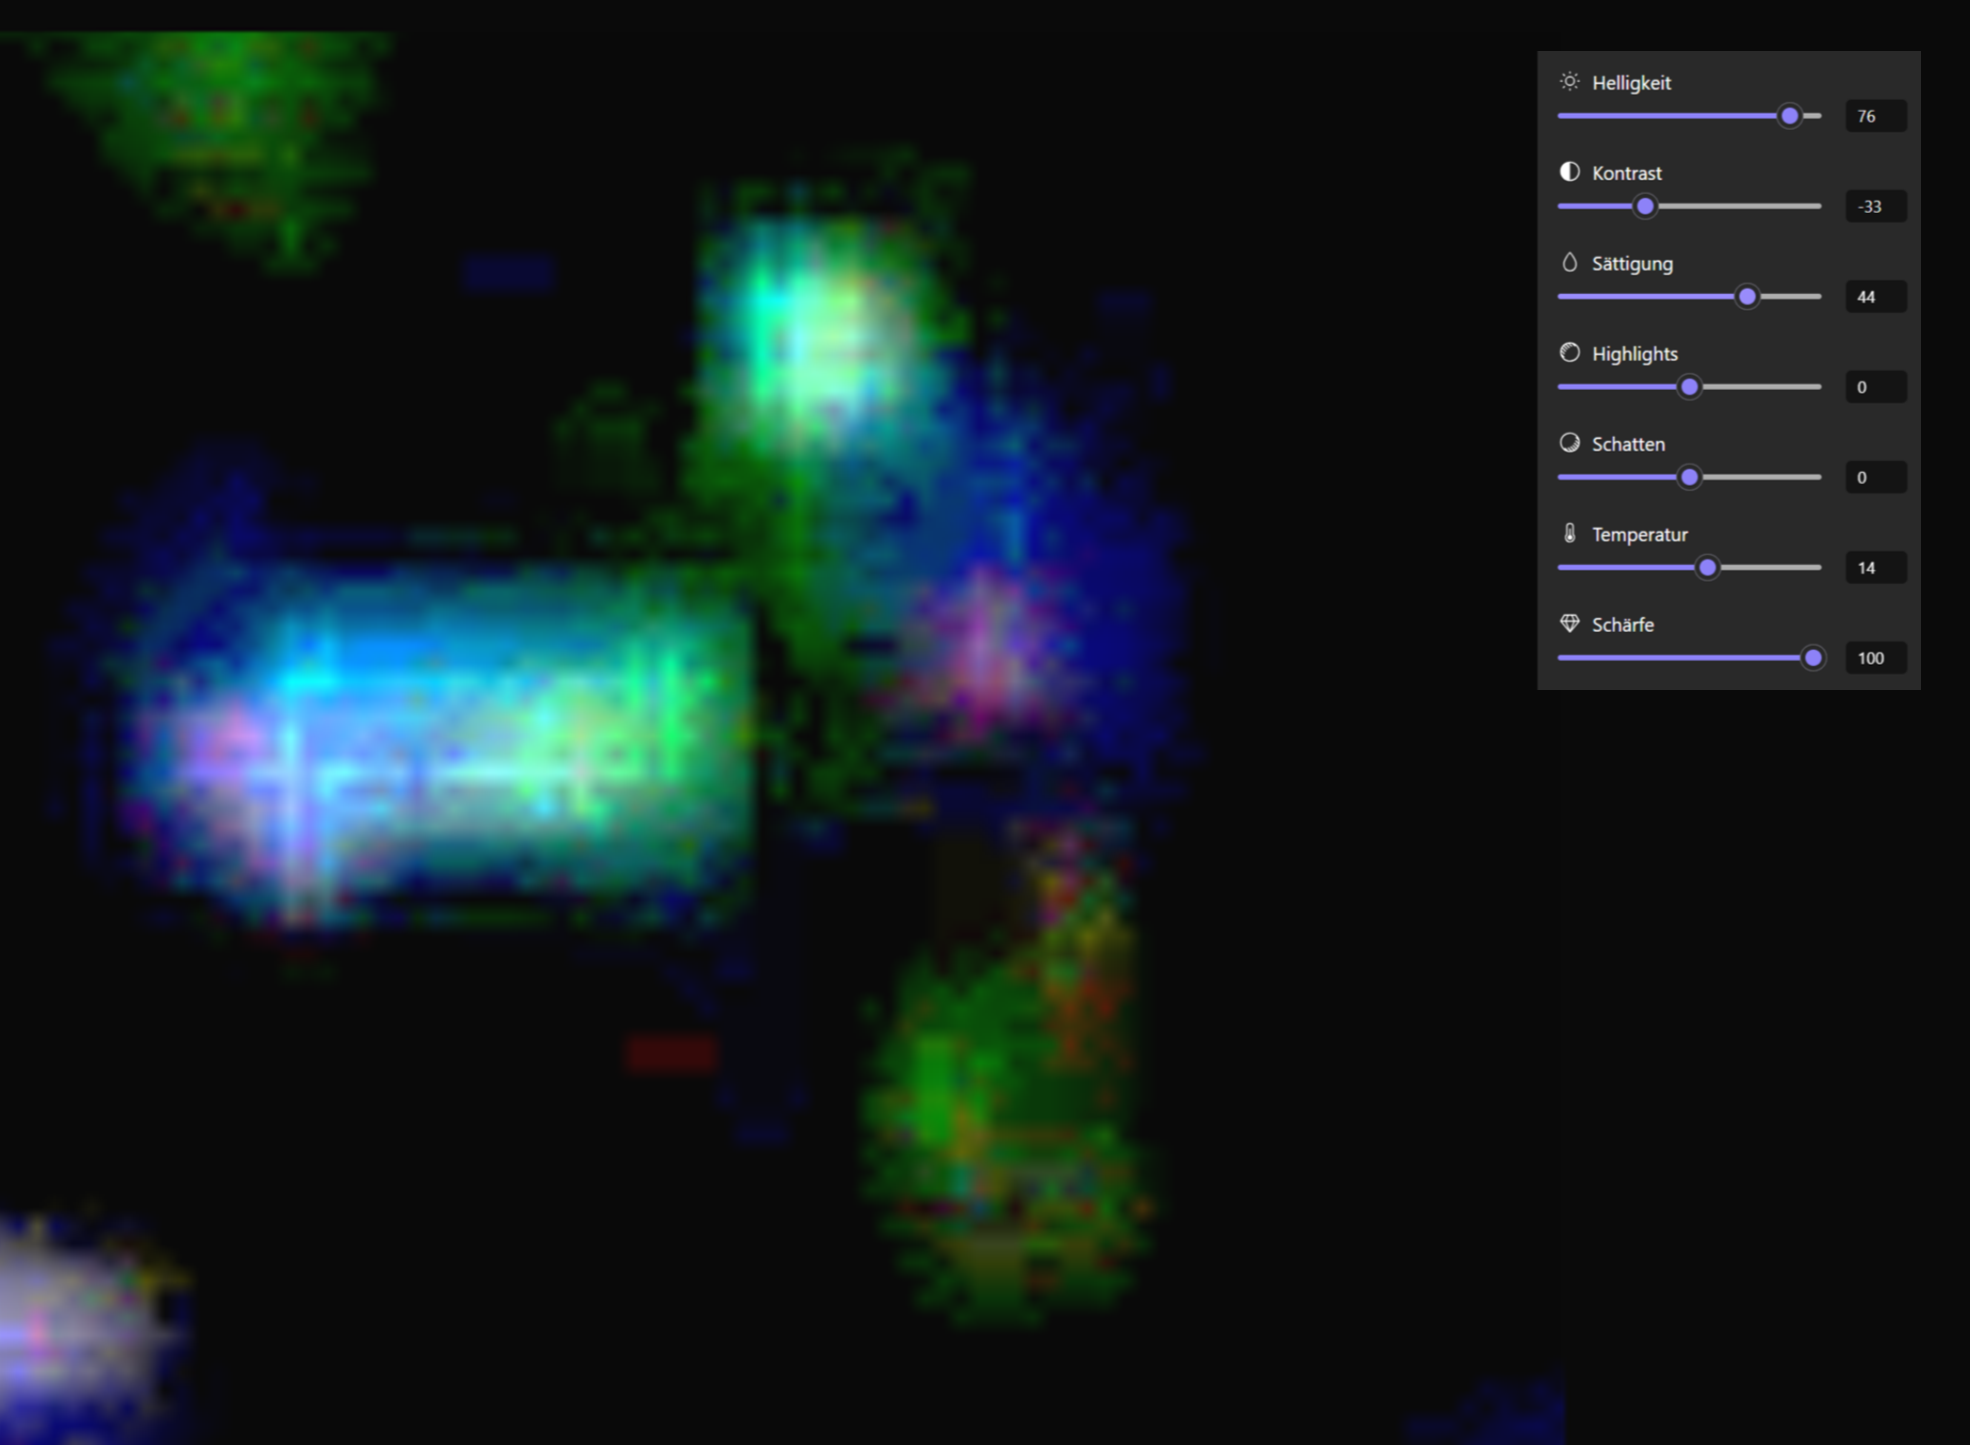
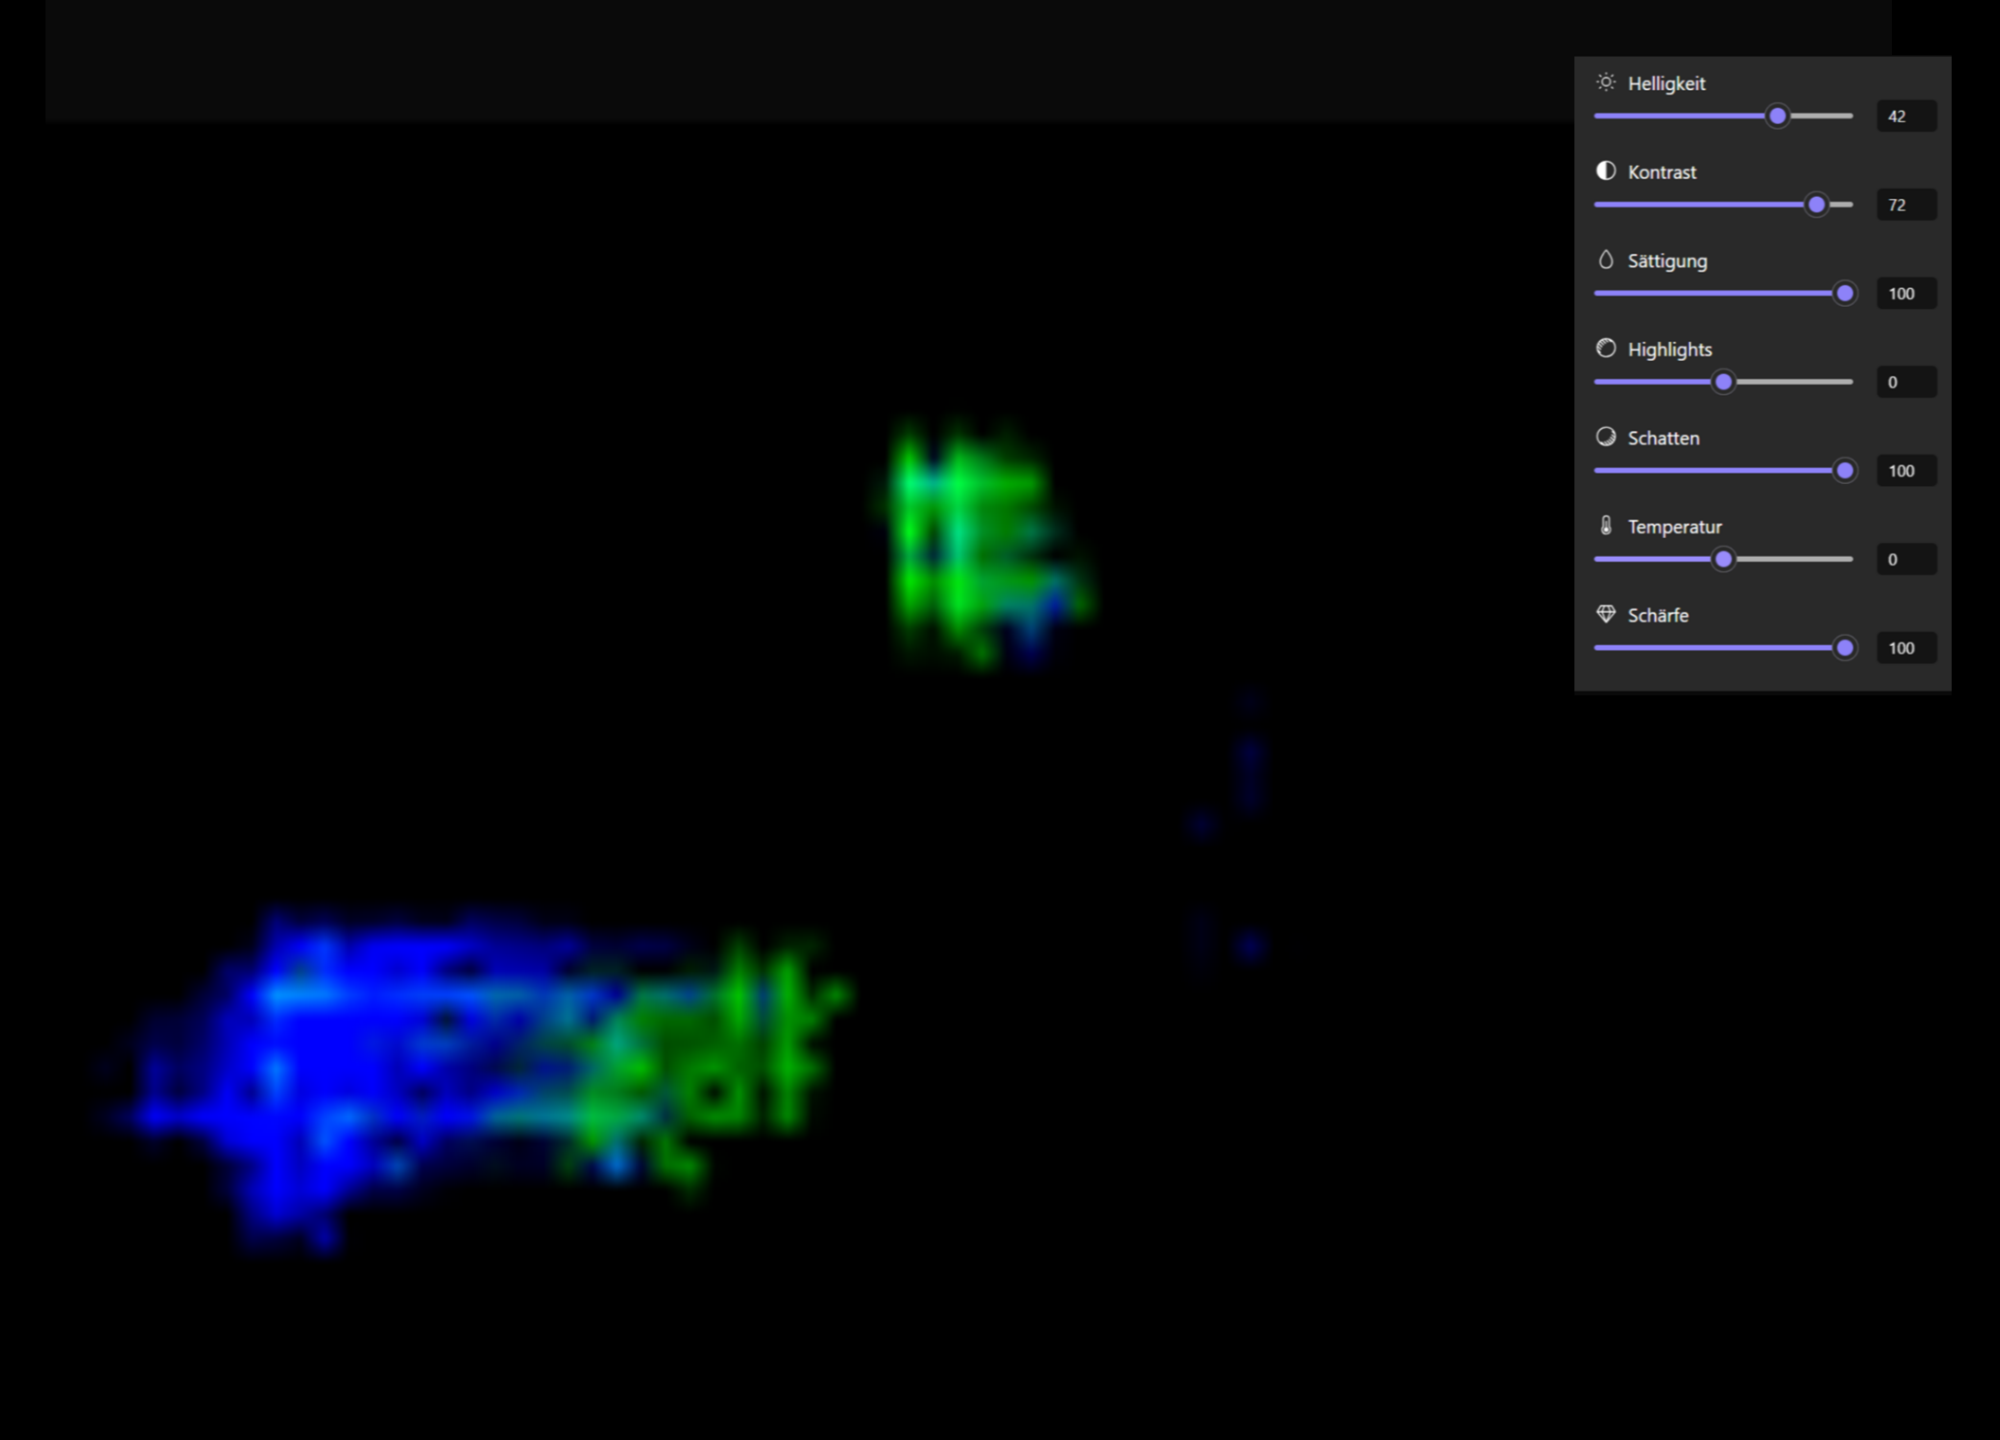
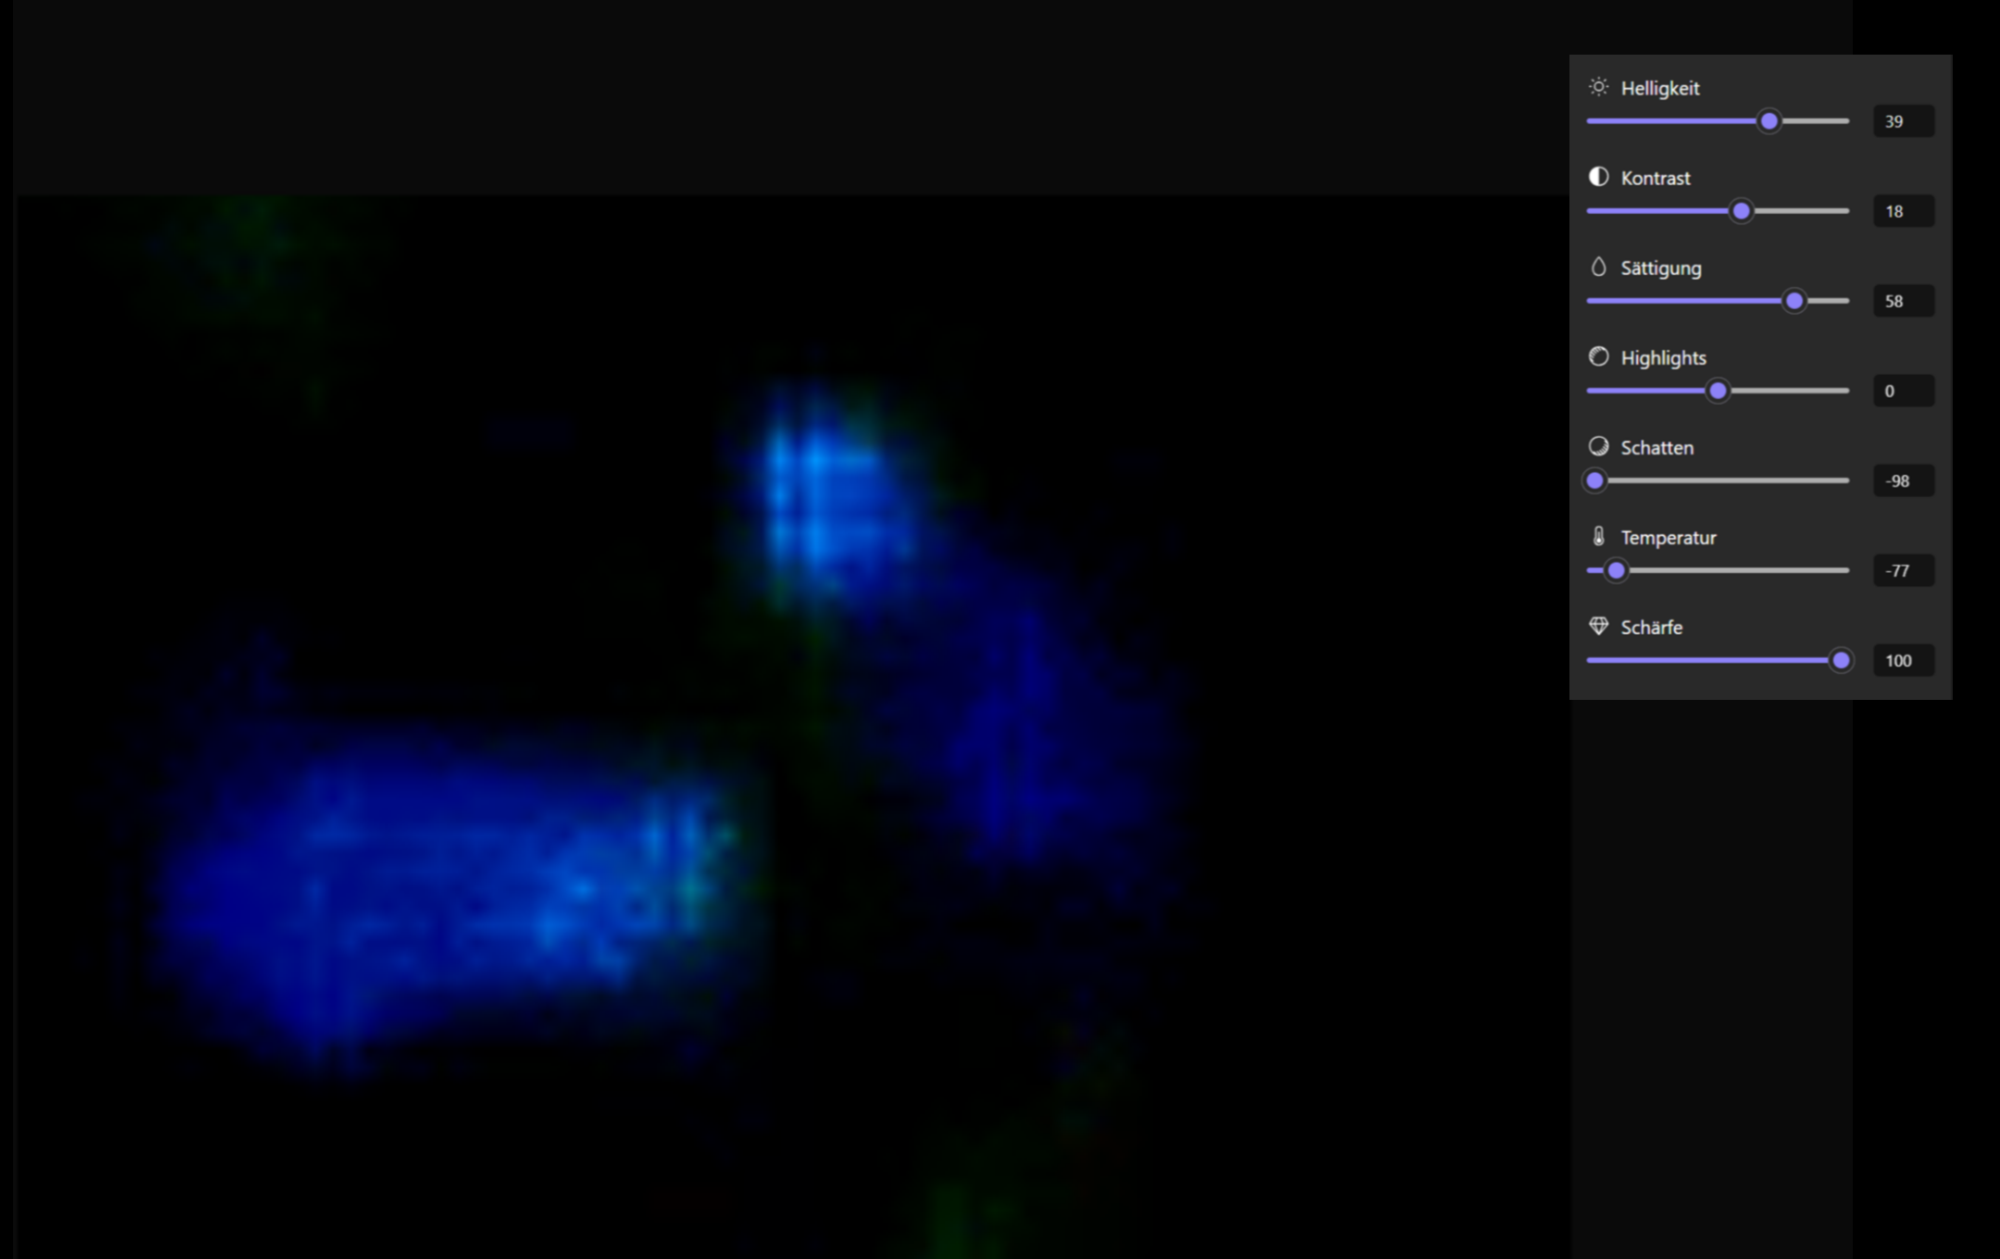
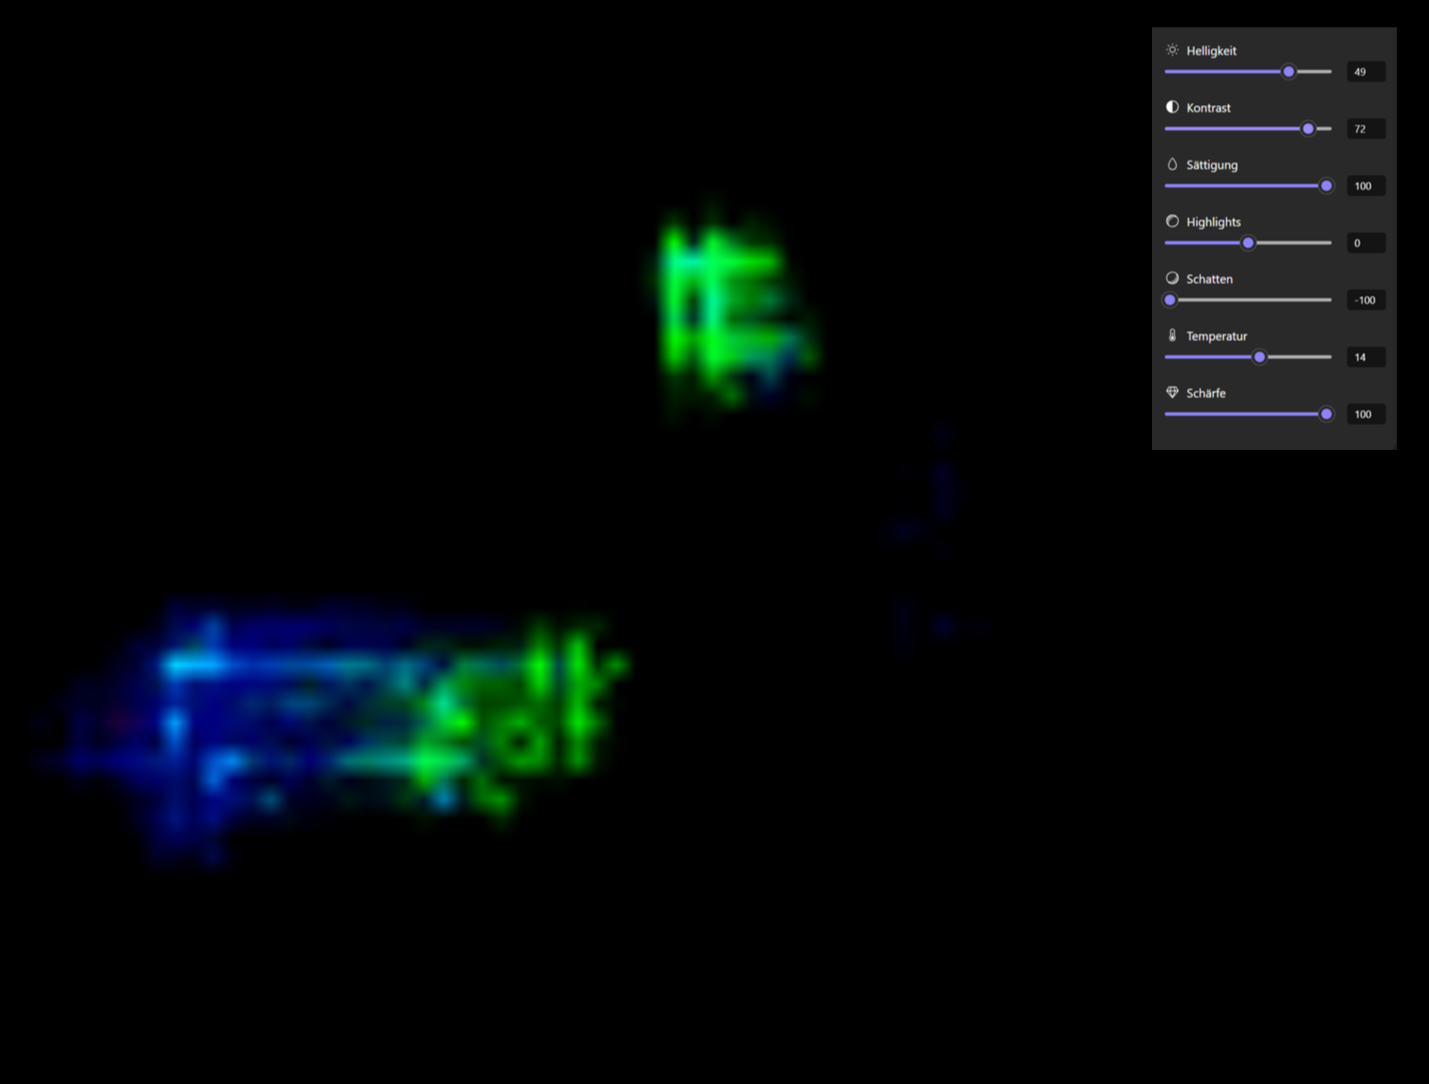
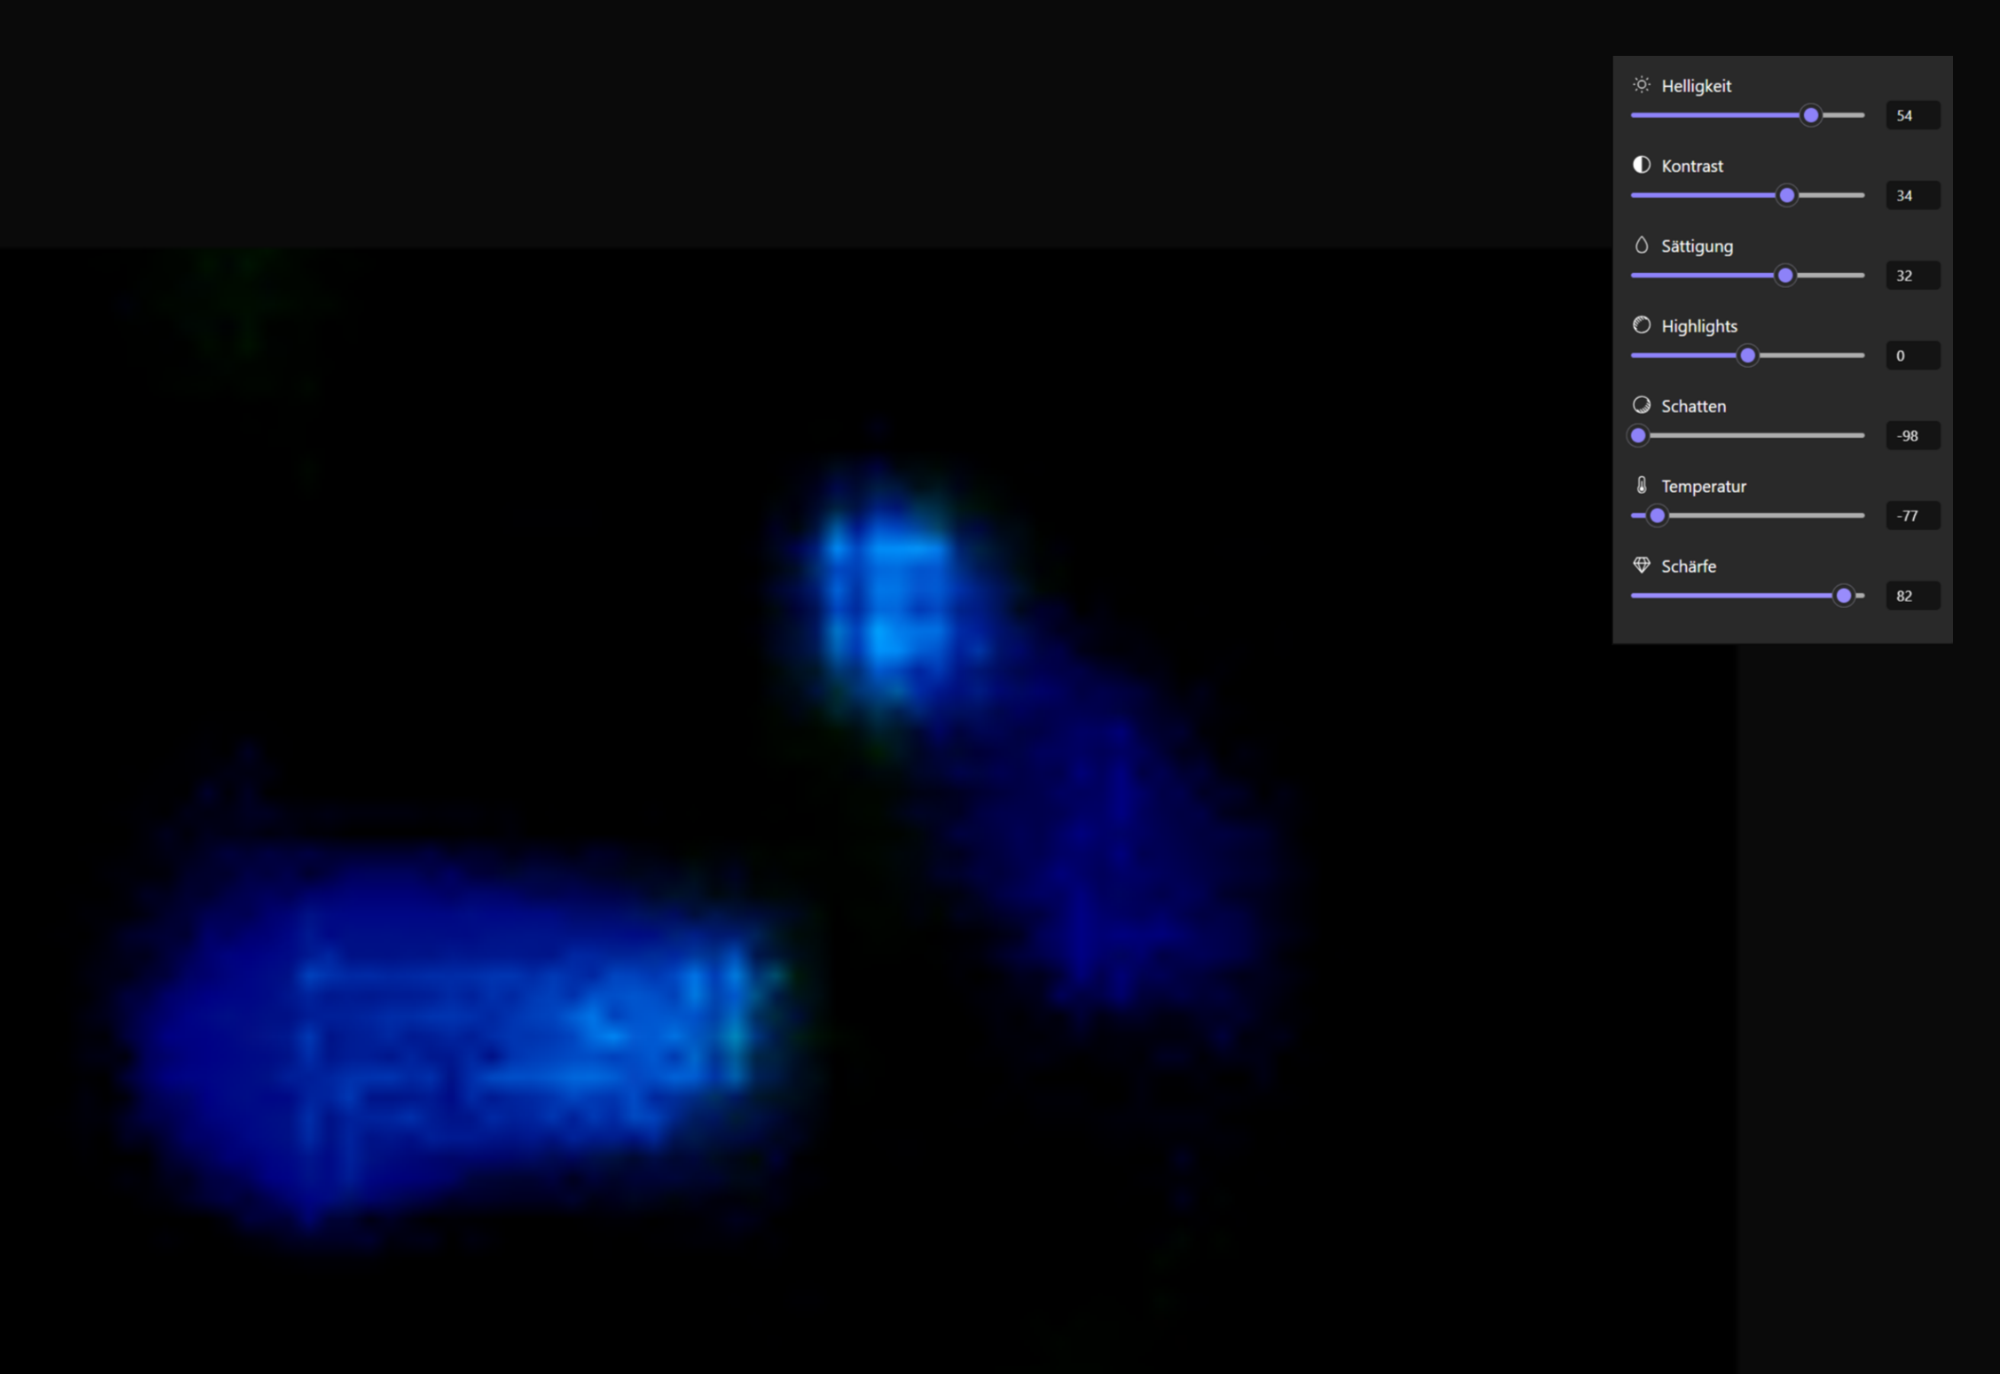
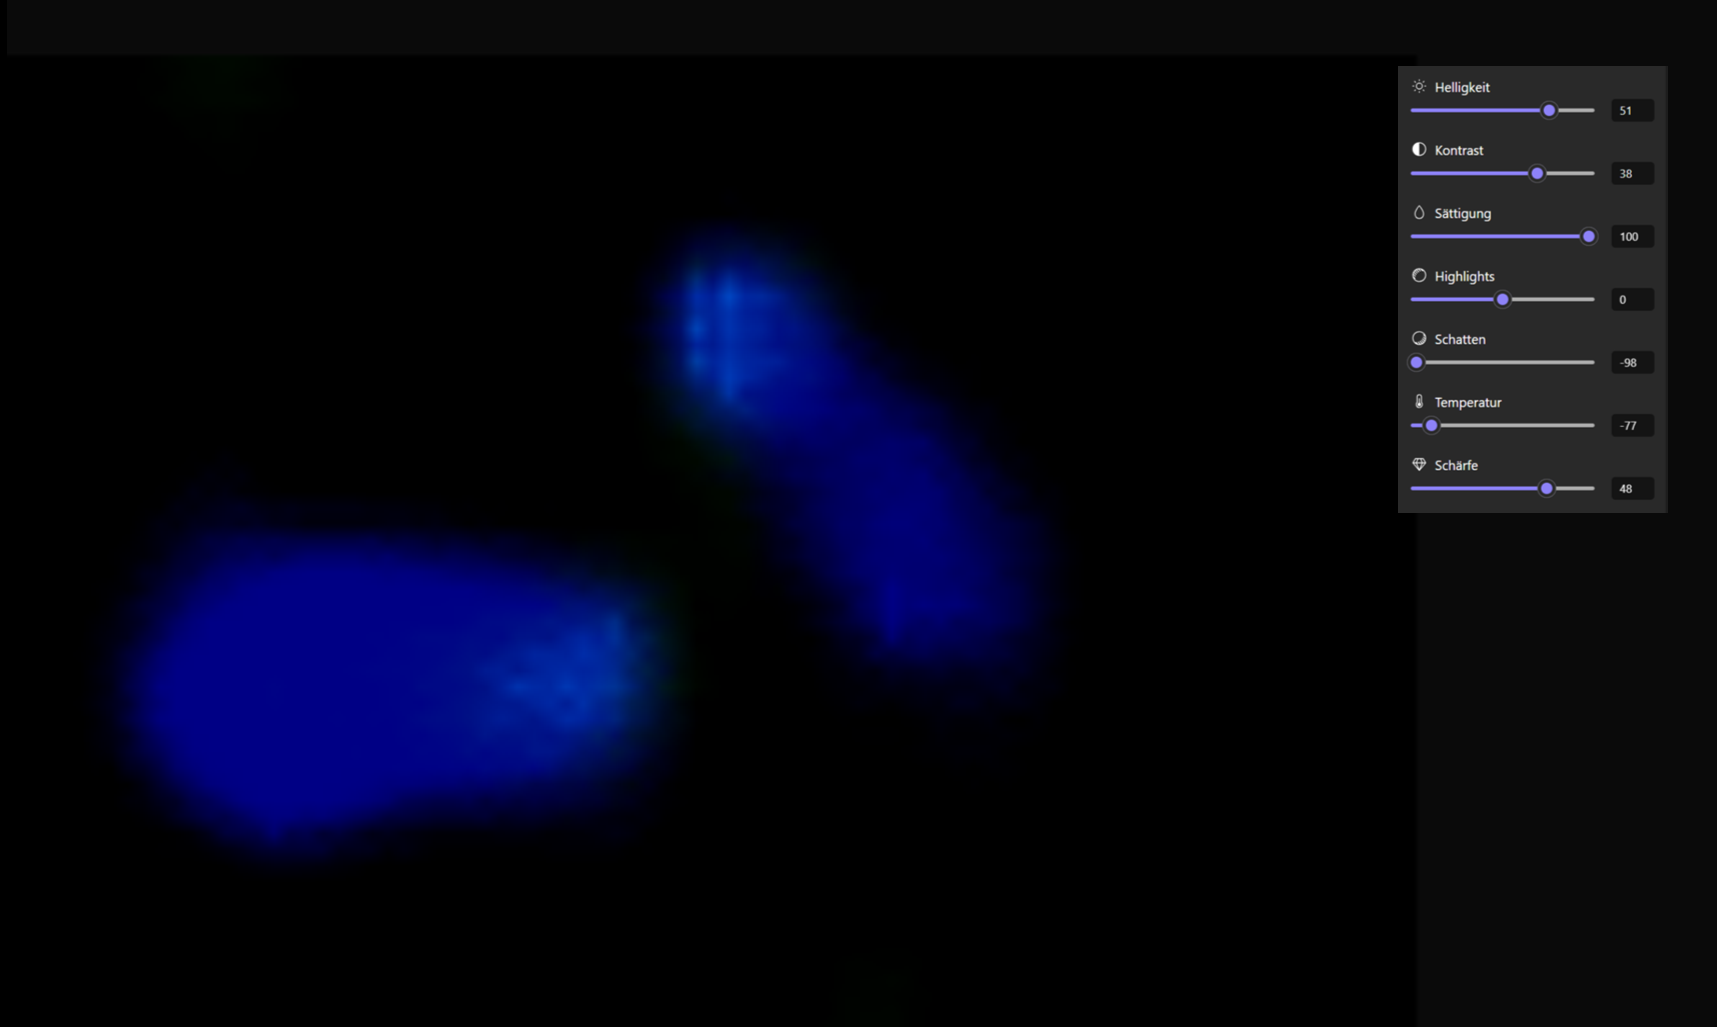
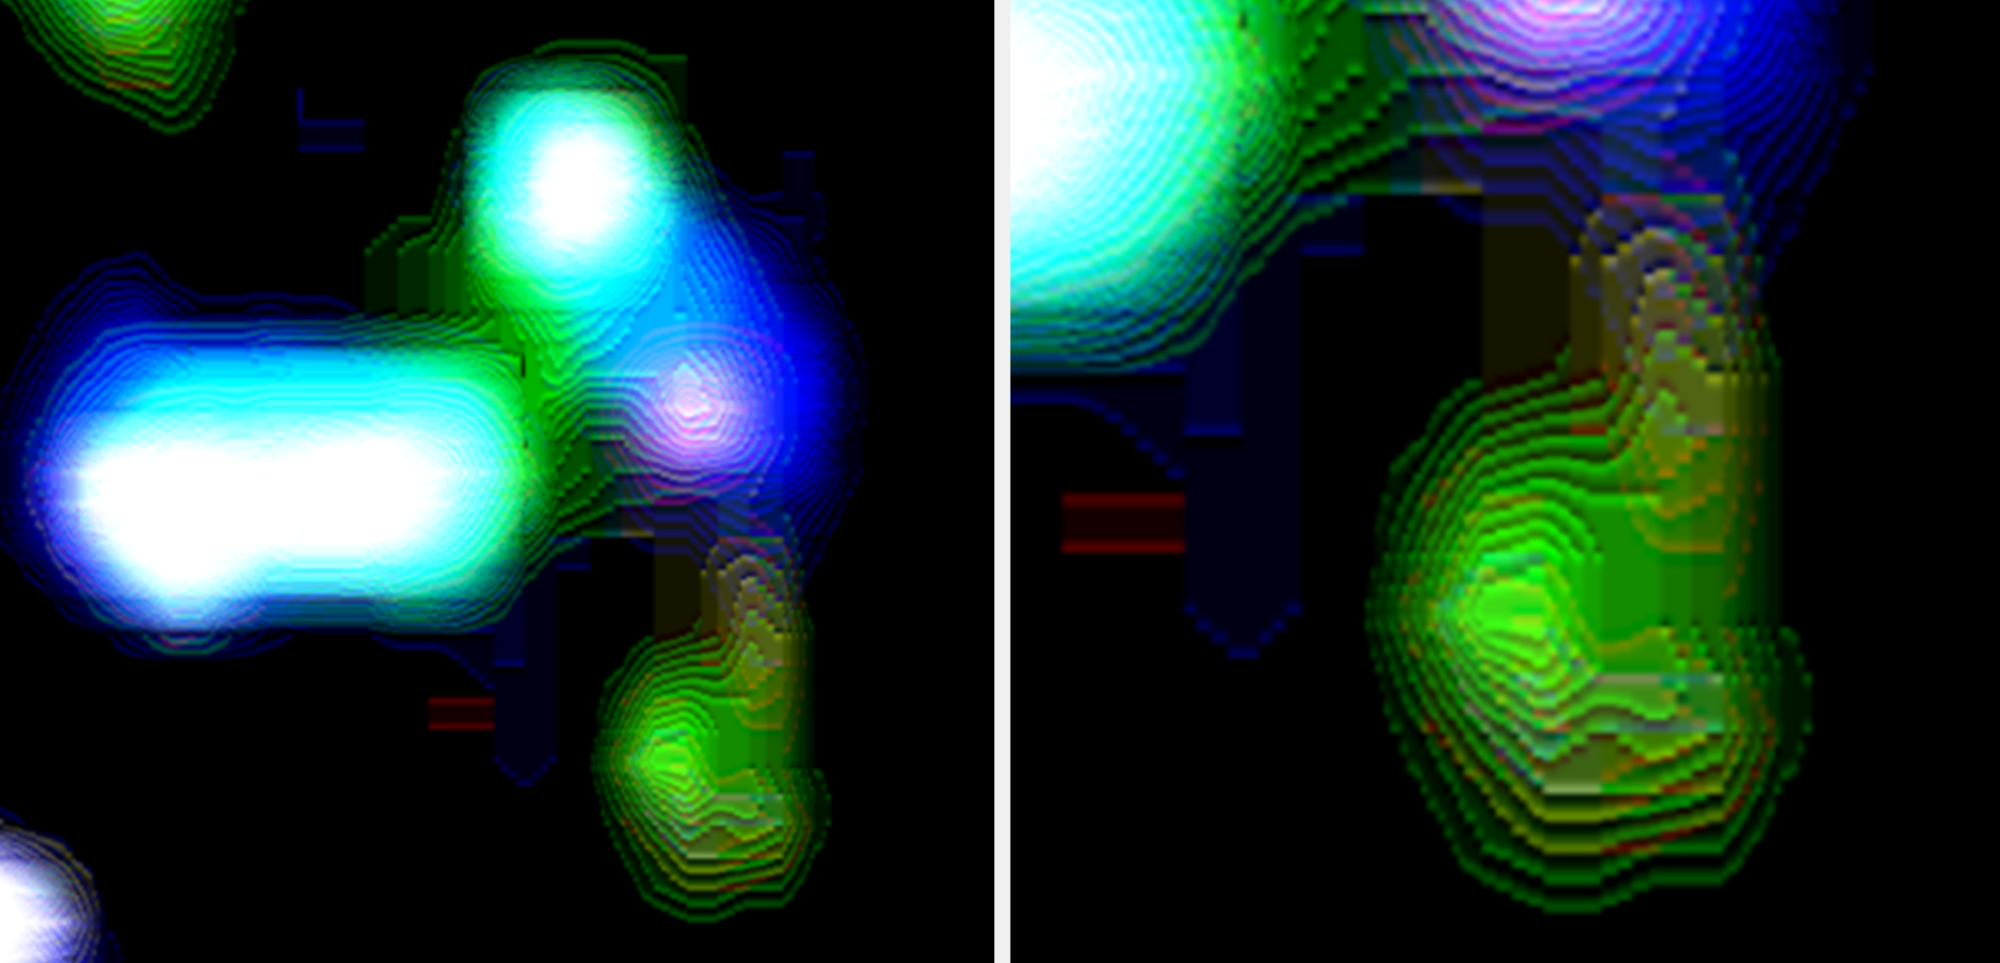
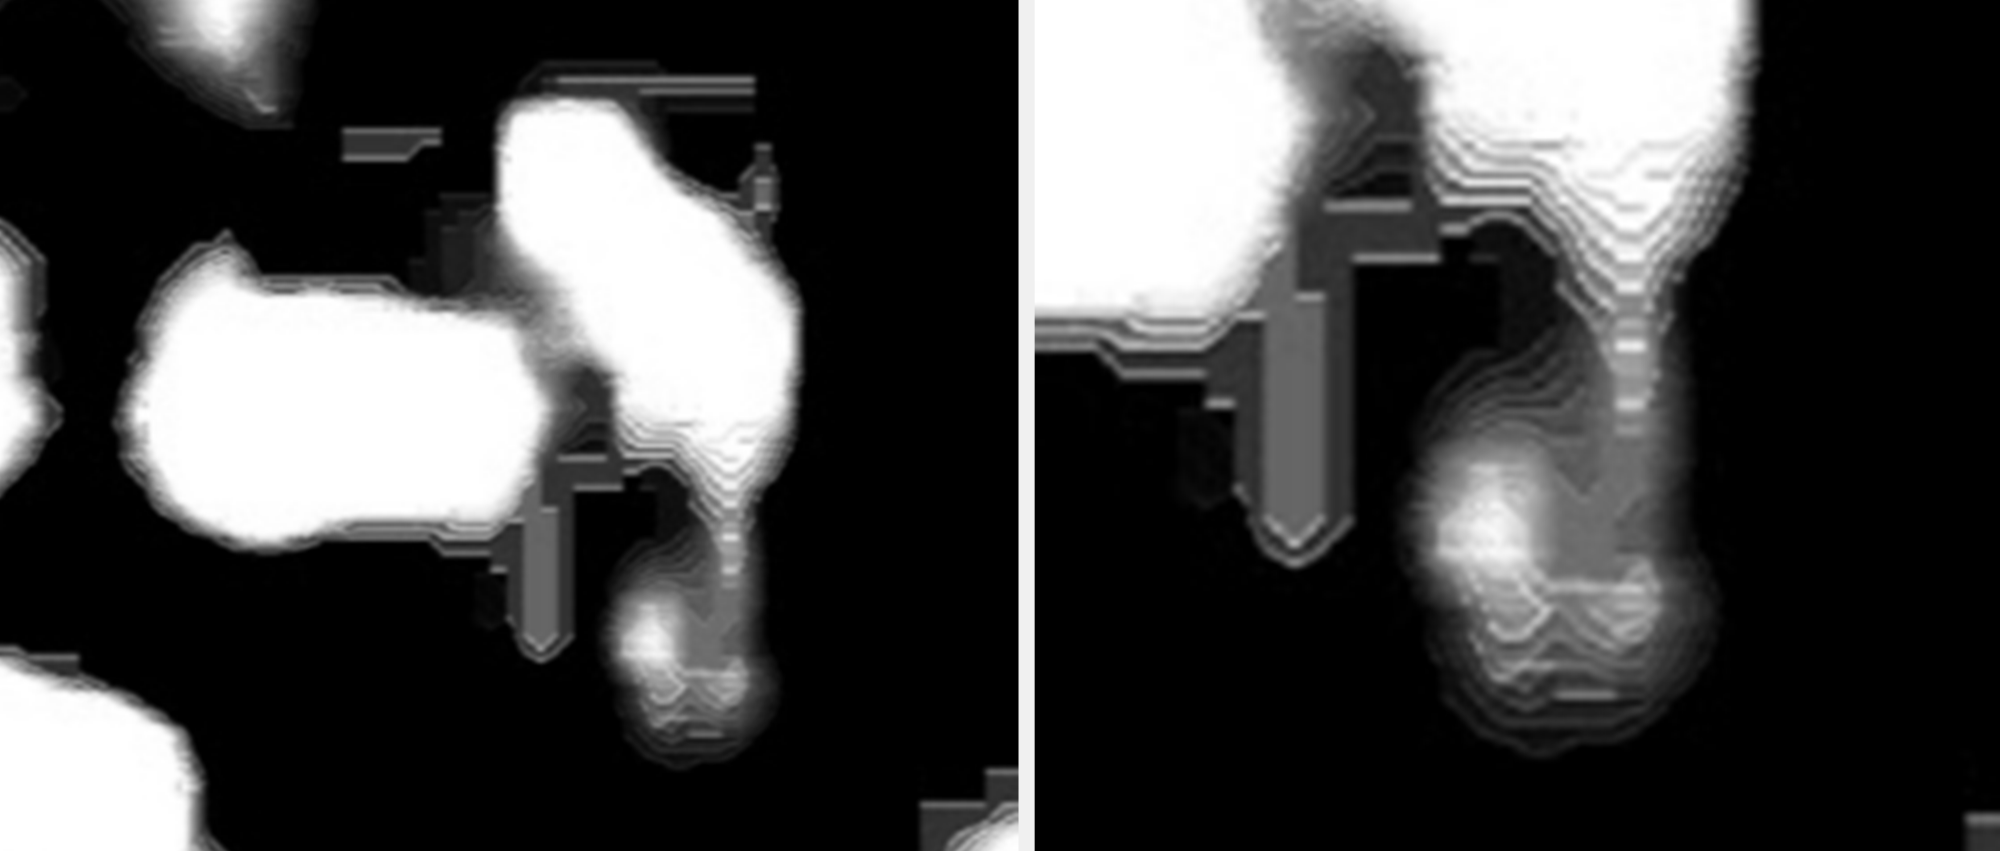

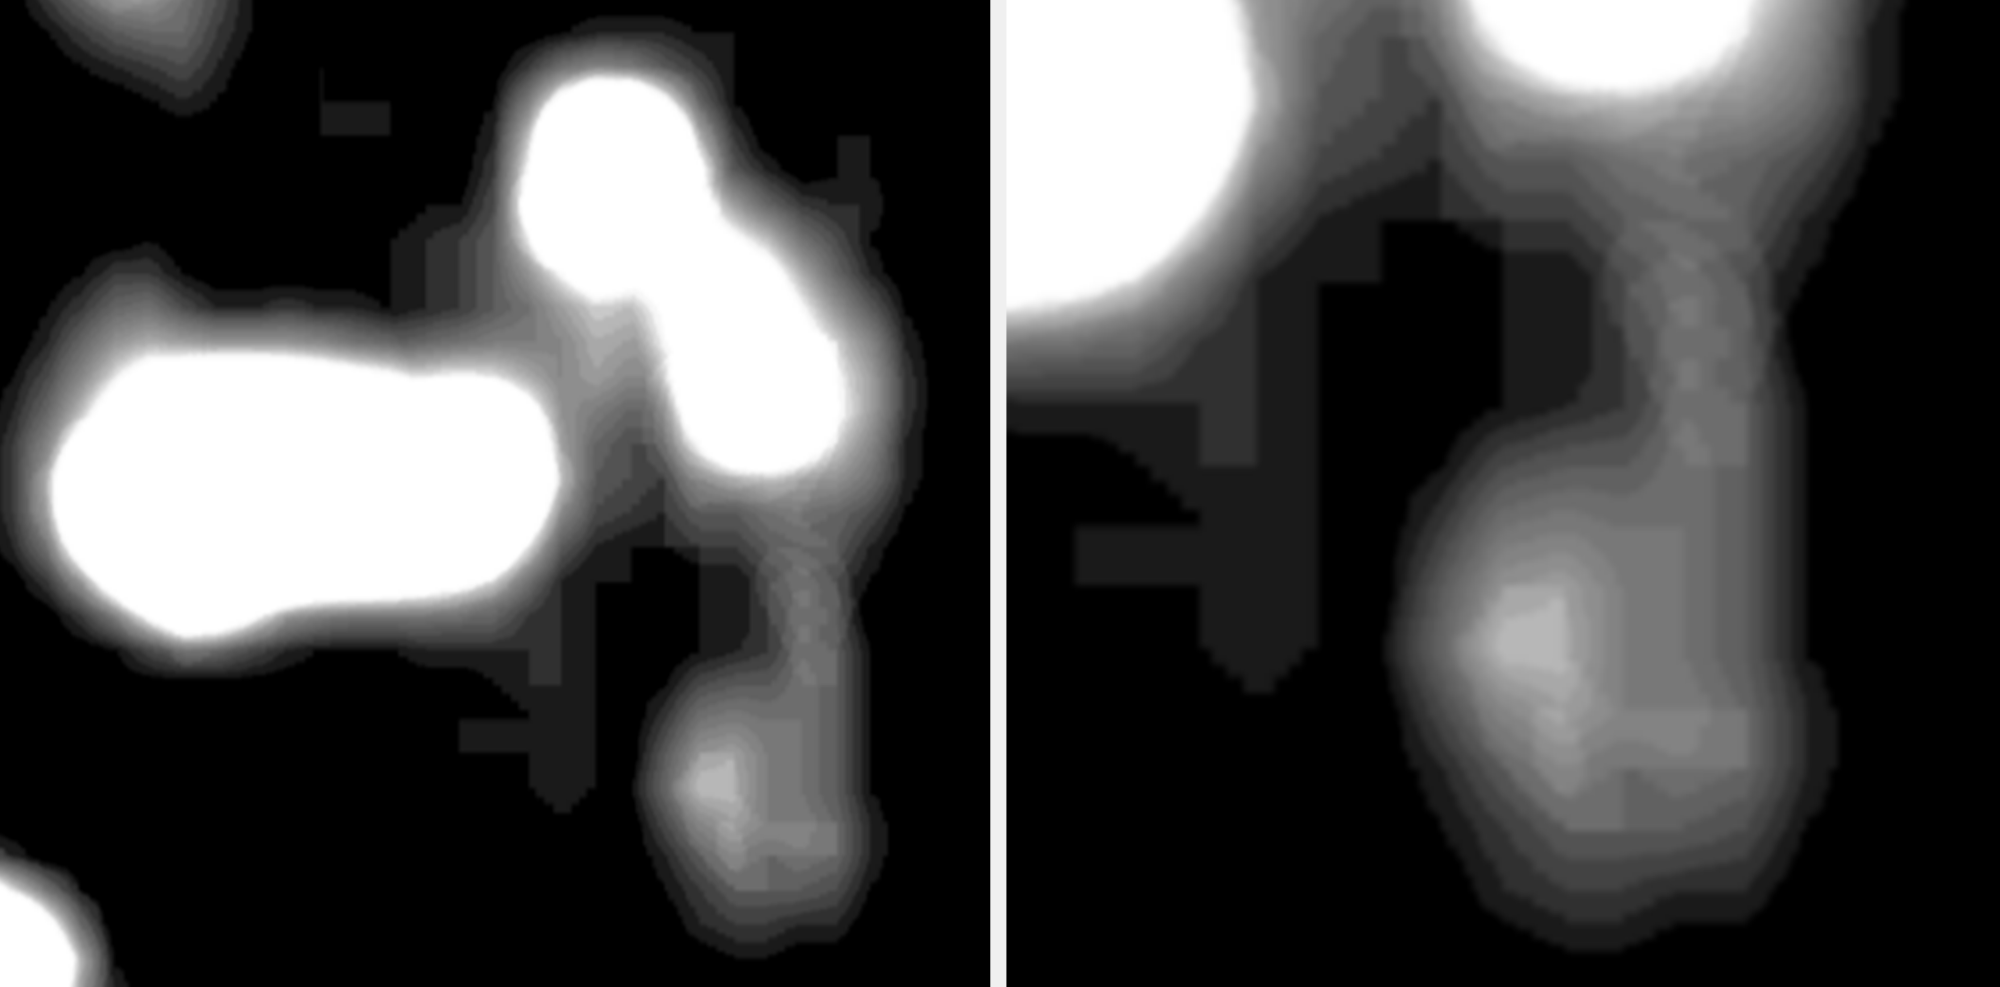
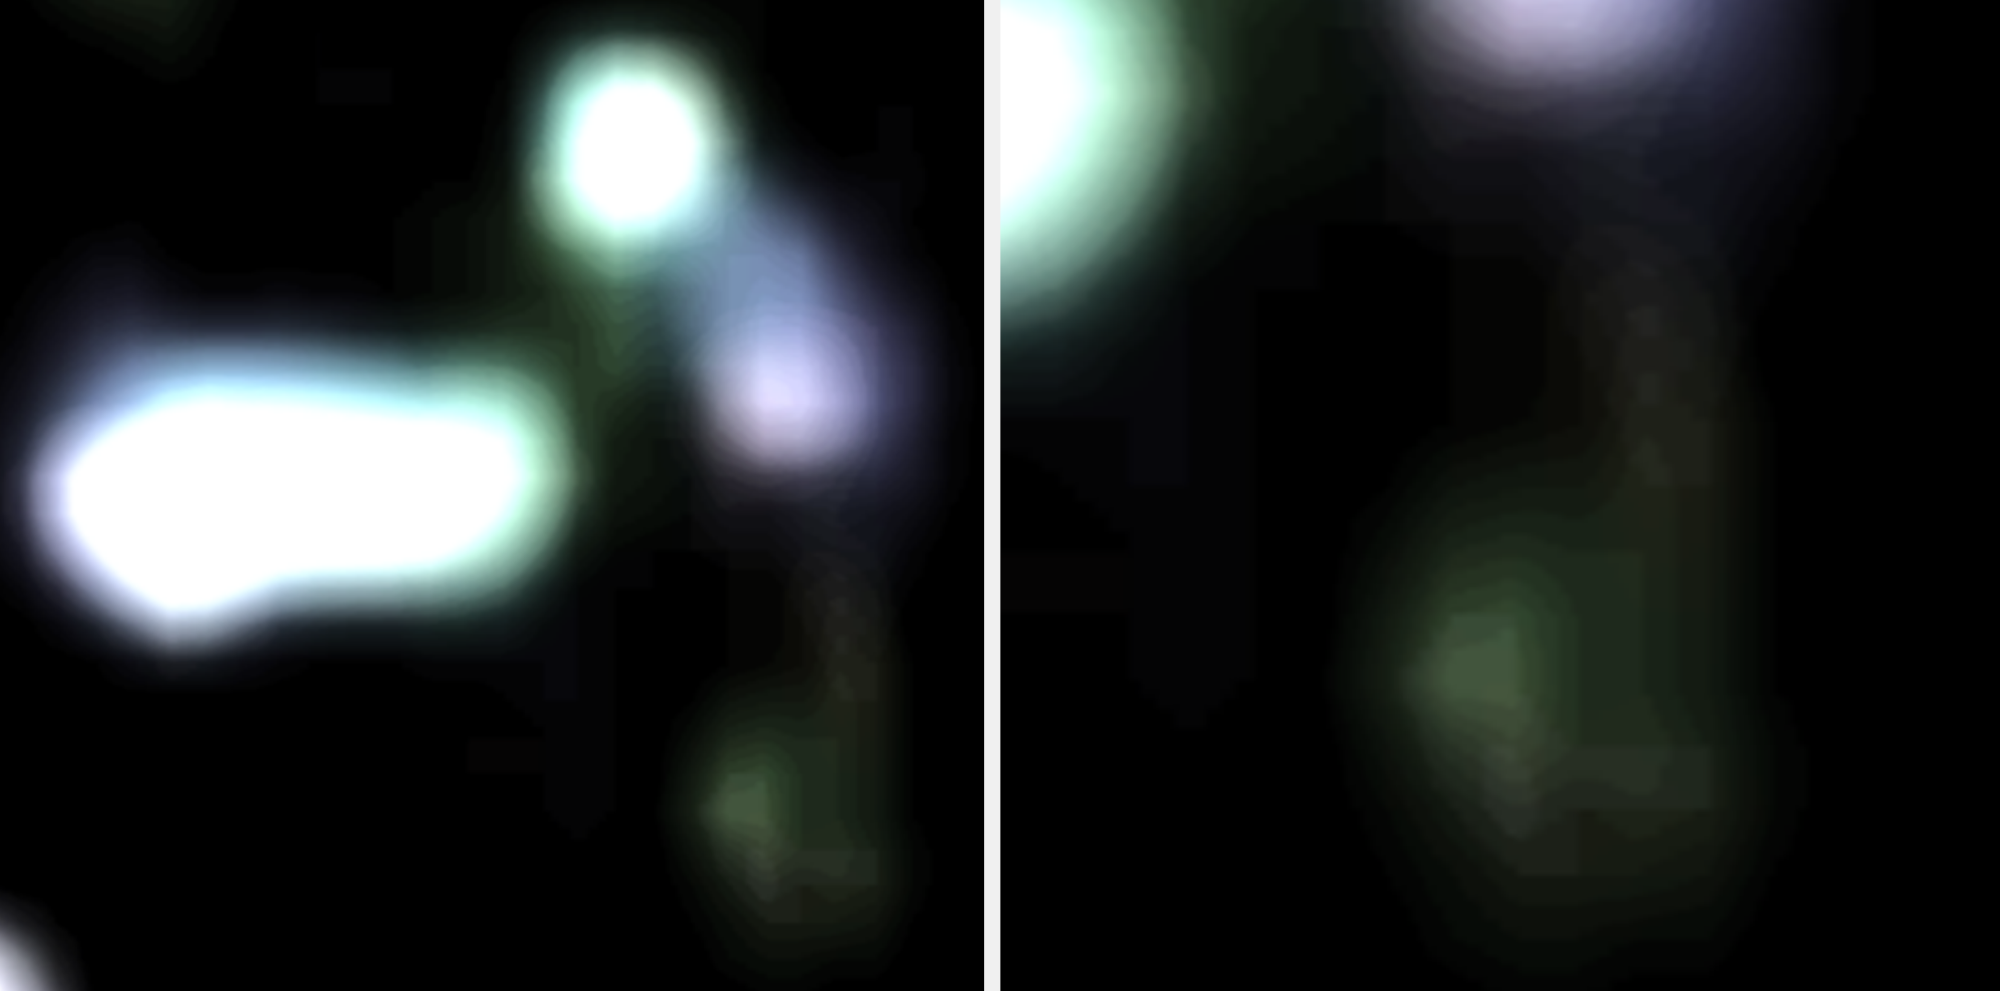
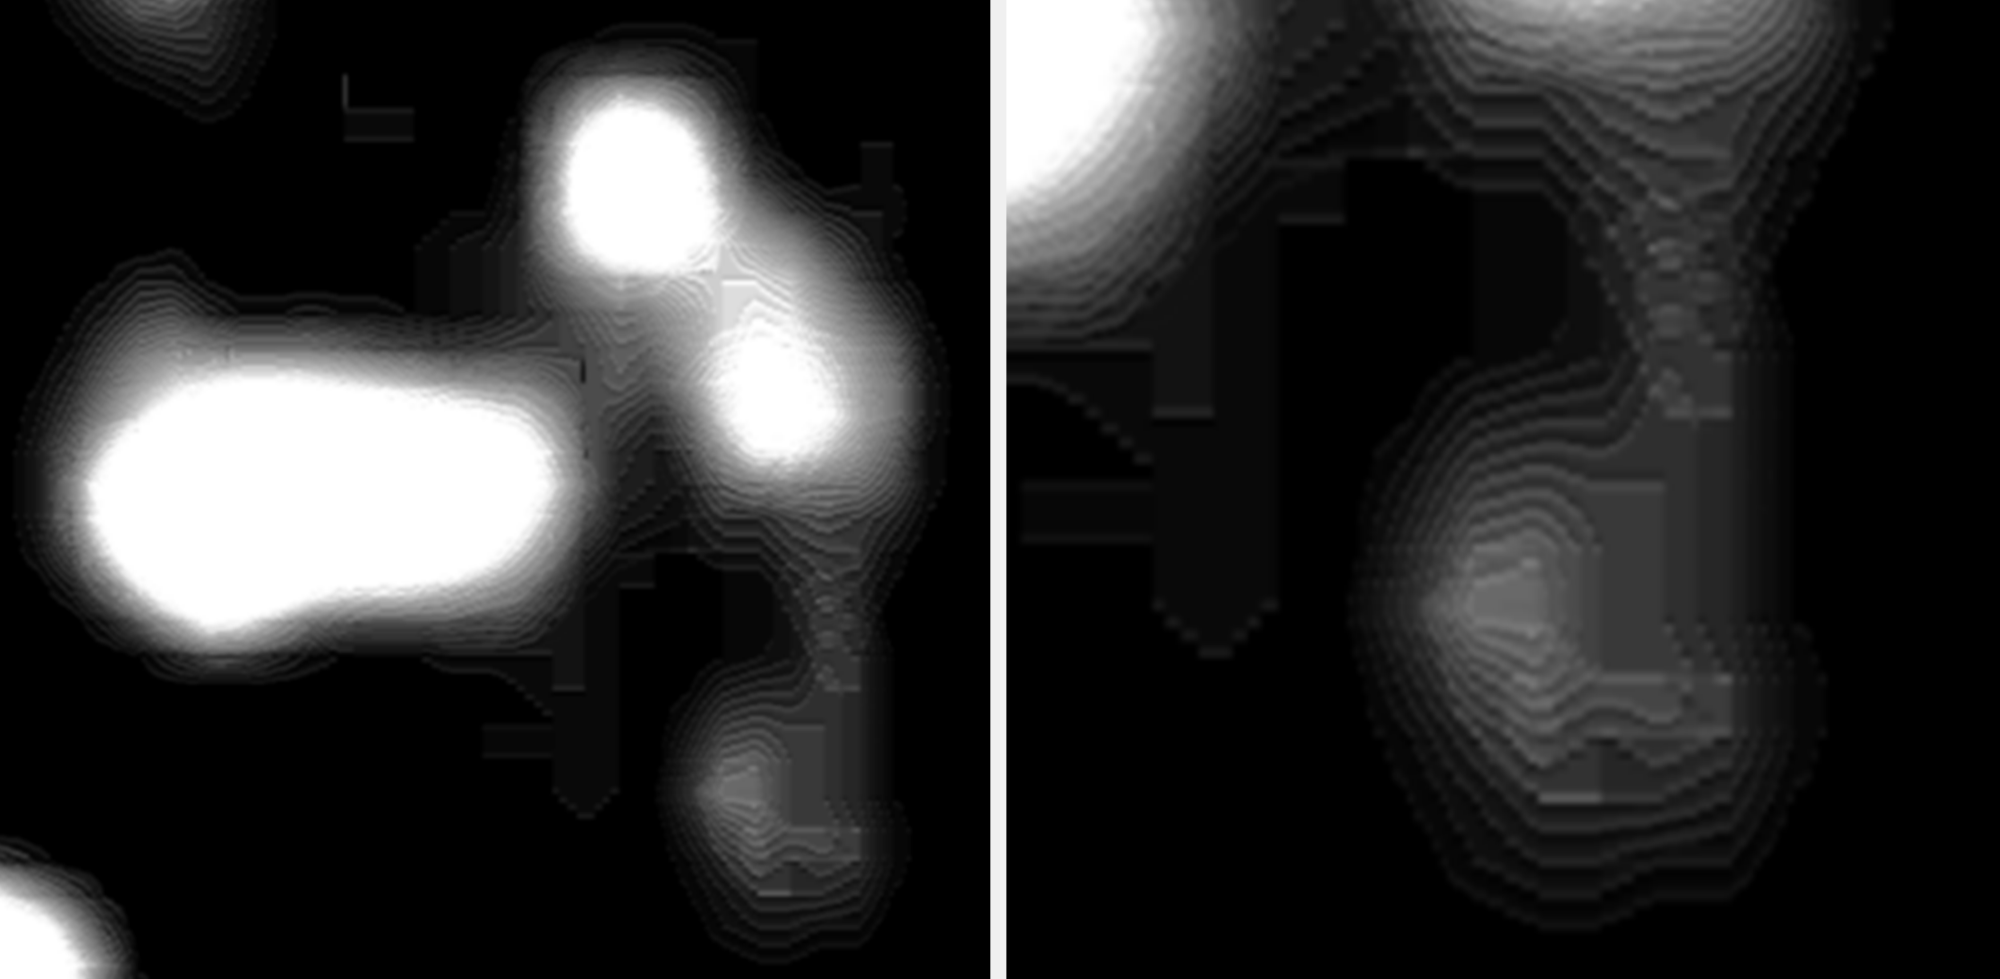
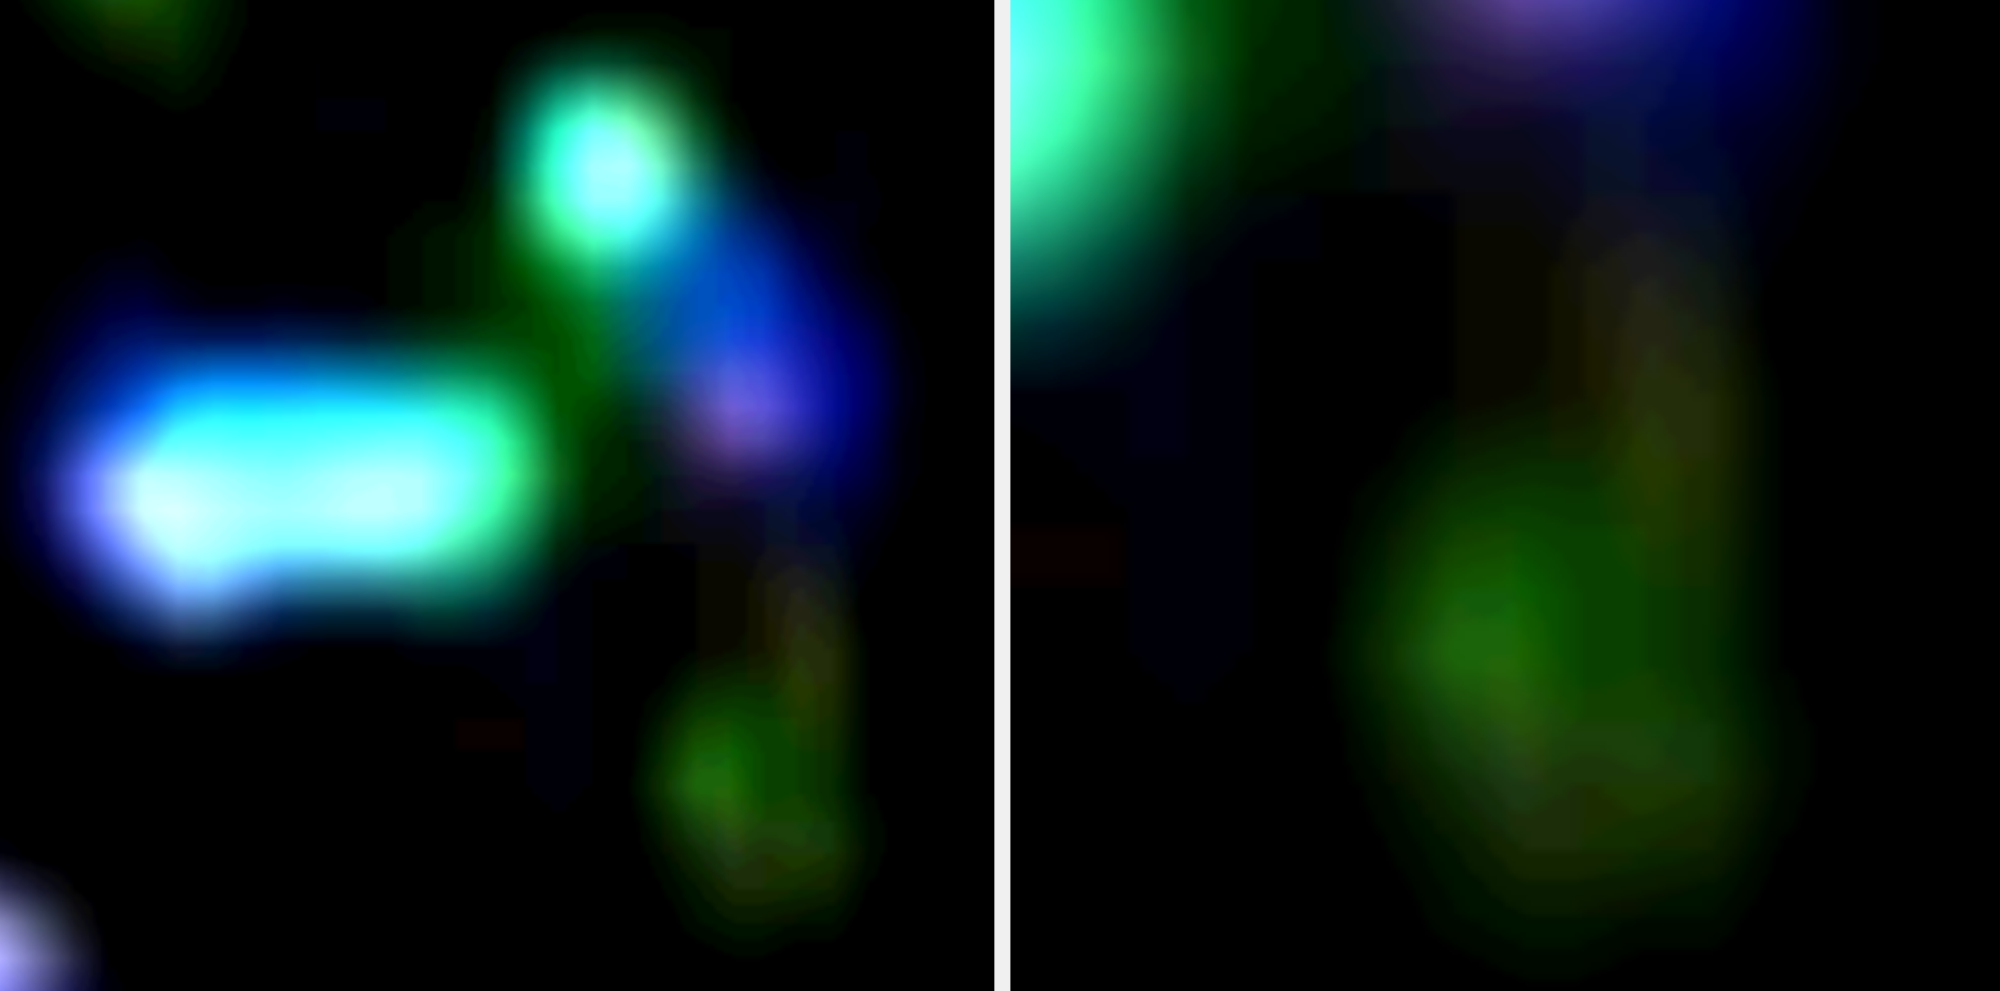
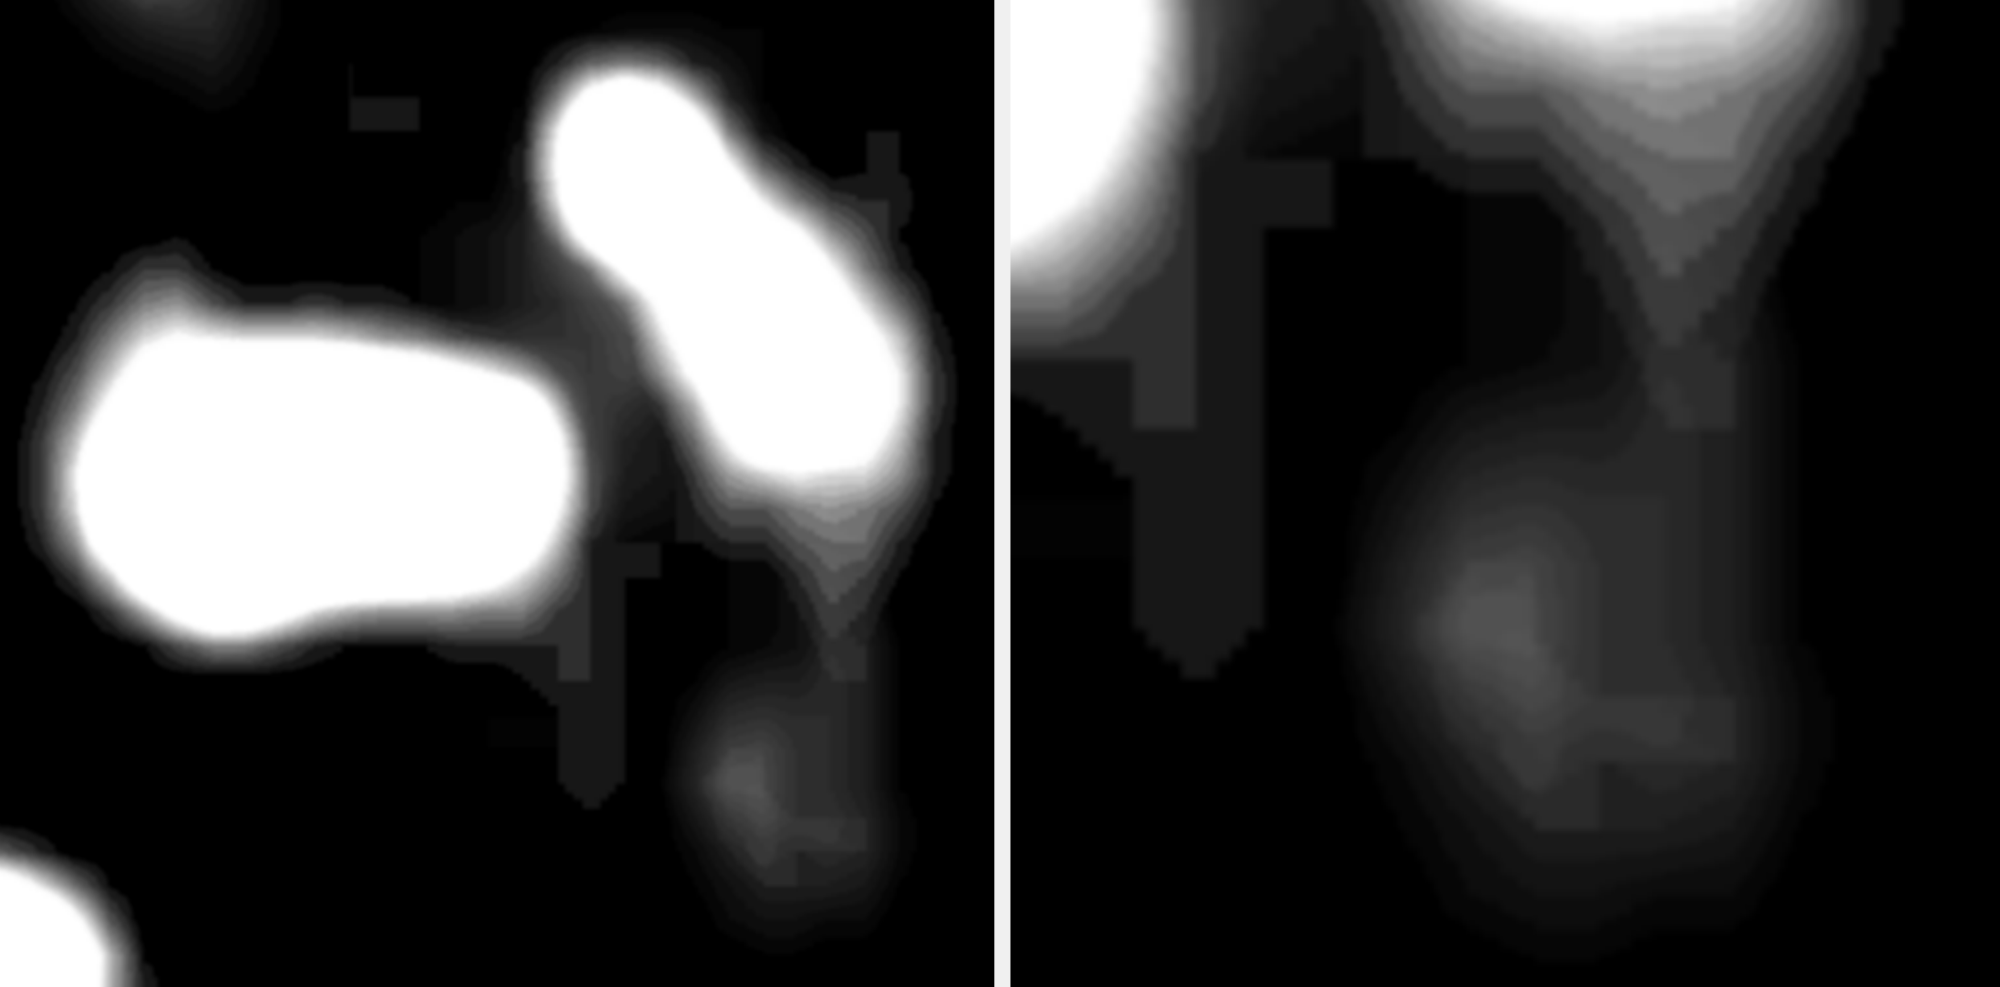
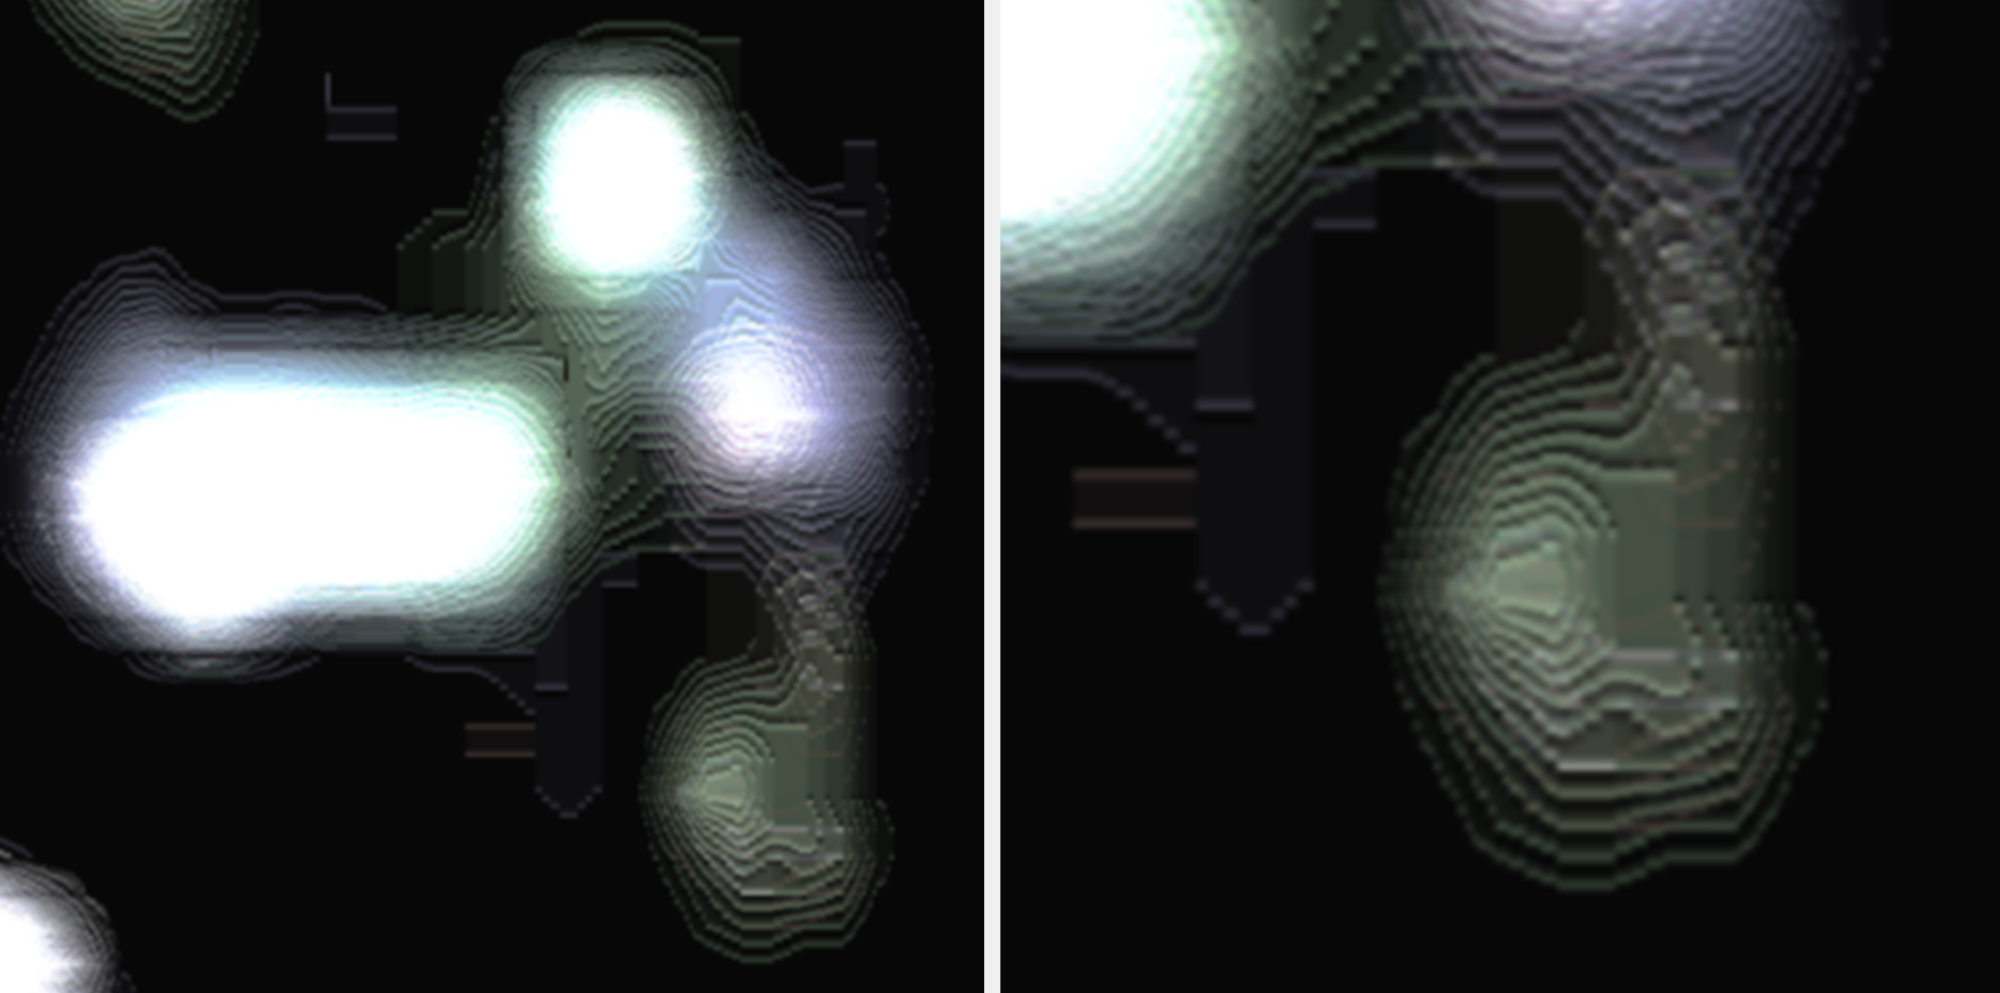
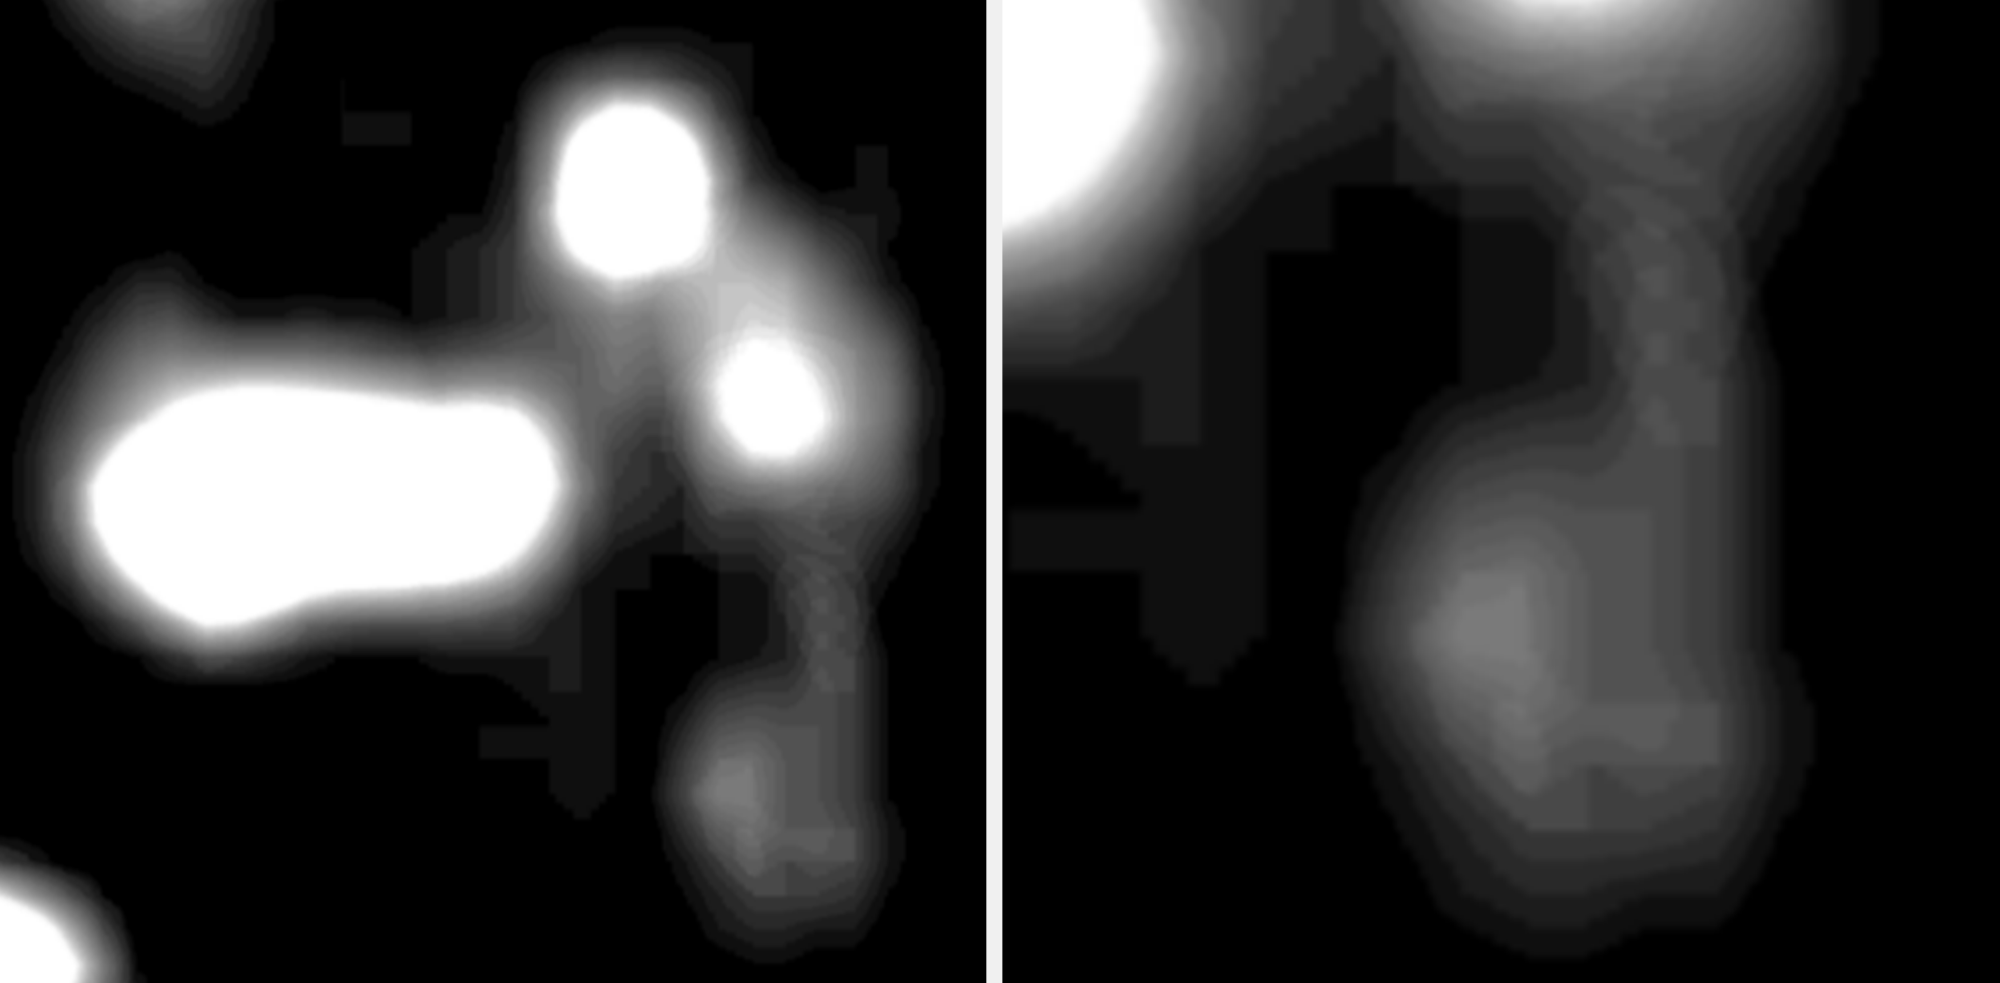
4. Analysis Results and Outlook
4.1 Synthesis of Visual and Metrological Findings
The initial visual examination and subsequent metric analysis of the high-resolution study area in source image 7 provided quantifiable and morphological evidence for the existence of a Constructed Biological Entity (CBE) whose structure is inconsistent with terrestrial biology.
- Metrical Rigidity (Ocular Structures): The metrological analysis demonstrated the exceptional geometric stability of the pupil positions and other ocular structures with a standard deviation (SD) of 0.01 pixels. Considering all image acquisition conditions, this value categorically rules out interpretation as an inconsistent image artifact and confirms a stable physical structure.
- Anatomical Deviation (Head Proportions): The identified ocular structures and head proportions (e.g., the large, hairless head relative to the human skull) are significantly incompatible with all known terrestrial vertebrate parameters.
- Visually documented Three-Dimensional Nasal Structure: The visual analysis of the nasal region revealed coherent line patterns suggesting a three-dimensional structure, including the nasal root, tip, and differentiated nostril openings. This spatial demarcation and the homogeneous, differentiated coloring of the nasal structure underpin the existence of an ordered, physical anatomy and distinguish it from random image artifacts.
- Specialized Oral Structure (Morphology & Physics): A clear oral structure was identified (consisting of upper and lower lip analogues). The light reflection confirms the physical existence of the structure. The morphology, particularly the shape of the lower lip analogue, which resembles a bird's lower jaw, hypothethically substantiates its specialized feeding function for the energy supply process.
4.2 Contextual Findings of the Supply System
The visual analysis provided unexpected insights into the CBE's lifestyle and physiological processes:
- Energy Supply Process: An energy supply process was identified in which a tube (B) extending from the reservoir delivers a liquid/mushy medium (C) under pressure to the oral interface.
- Fundamental Activity: The observed substrate uptake is a fundamental activity analogous to human behavior. This leads to the far-reaching conclusion that the need for an external energy supply applies to humanoid entities in general.
- Discrepancy in Visibility (QFS): The clear visibility of the CBE and its supply system, in contrast to the barely visible "normal Greys," is explained by the quantum field stabilization (QFS) hypothesis: The directly interacting supply system is integrated into the CBE's QFS protocol and ensures the stability of the transport process.
4.3 Conclusion and Implications for Science
The integration of metric, morphological, and contextual findings elevates the phenomenon from an anecdotal observation to a quantifiable physical object.
- Construction Principle: The near-perfect geometric invariance (SD: 0.01) implies a technological mastery of physics, in which the entity is stabilized by a continuously maintained energy field. This suggests highly advanced synthetic biology.
- Implications: The metrically verified identification of a Constructed Biological Entity that utilizes such an advanced construction principle confirms the authenticity of the examined source material from the Kumburgaz recordings.
Outlook:The results of this visual investigation and the subsequent metric analysis open a fascinating chapter in scientific UAP research. By quantifying the specific features of the entity examined here within the two-dimensional image space, we provide a methodological catalyst to publicly explore the complexity of non-human intelligences and to support the reordering of our currently shifting anthropocentric understanding of life and intelligence. In light of the steadily growing volume of publicly available visual data, the question arises for a scientific analysis that transcends mere observation.Our approach advocates examining NHI-relevant photographic and film material for its authenticity and treating such material with the necessary methodological depth–a necessary prerequisite to begin to scientifically grasp the complexity and diversity of these phenomena.
© 2026 Caroline Lacson
Location: Germany
5. References
This reference list contains the sources explicitly cited in the text.
A. Citation Style (APA Style)
Source Text Citation
UAP Video Sequence (Yalman) (Yalman, 2008)
Previous (External) Analysis (Valdés) (Valdés, 2010)
Definitions:
- UAP Video Sequence: The original recording by the witness (Murat Yalçın Yalman), which serves as raw material.
- Previous (External) Analysis: The first published graphic material that provided the Source Image 7 to be analyzed.
B. Bibliography
- Prof. Valdés, M. (2010). Analysis of the Kumburgaz, Turkey UFO Videos. National UFO Center (NUFOC). Retrieved from https://nationalufocenter.com/2013/10/analysis-of-the-kumburgaz-turkey-ufo-videos/
- Yalman, M. Y. (2008, 8. Juni). Turkey UFO Original Raw Footage (1 of 3) 2008 UFO In Kumburgaz, Turkey Over Marmara Sea, Genuine UAP Original Witness Mini DV Film [Video]. YouTube. Tetrieved from https://youtu.be/imwqRPr83is?list=PLLxHwkkuCQiAxs41N15DzcPl46IbJaQ27